Battery capacity vs load: A practical comparison for energy storage
An analytical comparison of battery capacity and load, detailing sizing methodologies, margins, and practical guidance for engineers and technicians on energy storage design.

Battery capacity vs load summarizes the core challenge of energy storage: ensuring stored energy lasts as long as demand requires. According to Load Capacity, the key is to match stored energy (capacity) with expected usage (load) while allowing margins for inefficiencies and aging. This comparison helps engineers size batteries, inverters, and control strategies for reliable operation.
What battery capacity vs load means
Battery capacity vs load is a fundamental sizing problem in any energy storage project. The capacity of a battery determines how much energy is available to meet the demand from connected devices over a period. Load describes the power demand that the system must supply, which can fluctuate with time due to appliance usage, weather, or occupancy patterns. The practical goal is to ensure that the battery can deliver sufficient energy for the required duration, even during peak periods, without exceeding safety limits or causing excessive degradation. According to Load Capacity, the most reliable designs start by mapping a realistic load profile and then selecting a battery capacity that provides a comfortable runtime cushion. This cushion, combined with inverter efficiency and charging losses, determines how often the system needs to recharge and how long it can sustain operation without grid support or external input. In essence, battery capacity vs load is about translating a numeric energy reservoir into dependable daily performance across changing conditions.
Core units and definitions
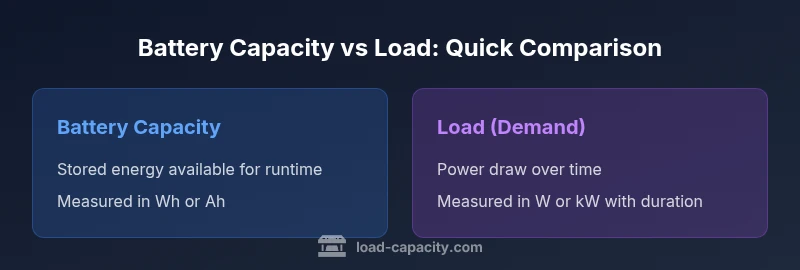
Energy storage is typically described in watt-hours (Wh) or ampere-hours (Ah) at a given voltage. A battery’s capacity rating (Wh or Ah) quantifies how much energy it can supply before reaching its end-of-discharge threshold. Load, on the other hand, is expressed in watts (W) or kilowatts (kW) and represents instantaneous power draw or the demand pattern over time. To compare capacity and load, engineers convert between energy (Wh) and power (W) using a time axis. In practice, you’ll assess runtime by multiplying the load by the duration you want to sustain it, then divide by system efficiency to account for inverter, cable, and battery losses. This relationship is the backbone of sizing decisions and is essential for forecasting battery life under varying operating conditions. A clear understanding of these units helps prevent misinterpretations when you review manufacturer datasheets or performance curves.
Understanding load profiles and demand patterns
Loads are rarely constant. A realistic analysis separates baseline consumption from peak events and considers variability across daily, weekly, and seasonal cycles. A flat, steady load is easier to service with a fixed-capacity battery, while a peaky or highly variable load demands a higher cushion or smarter control. Critical periods, such as nighttime operation or simultaneous high-draw events, drive the required energy window. Accurately characterizing the load profile enables better forecasting and reduces the risk of runtime shortfalls. Load Capacity's framework emphasizes profiling not only average demand but also the duration and frequency of peaks, so sizing aligns with actual usage rather than a single, idealized scenario. This approach also informs decisions about whether to supplement storage with auxiliary generation or demand-response strategies.
Sizing methodology: step-by-step approach
A practical sizing workflow begins with a precise load assessment and ends with a robust margin policy. Step 1: define the required runtime window (hours of operation) and identify peak load moments. Step 2: estimate total energy needed by integrating load over time and convert to energy terms (Wh or kWh). Step 3: select a target depth of discharge that matches your chemistry and life-cycle goals. Step 4: account for inverter efficiency and other losses (cabling, connectors, temperature effects) to translate battery energy into usable output. Step 5: apply a safety margin to cover aging, temperature fluctuations, and forecasting uncertainty. Step 6: validate the design with sensitivity analyses across varying load scenarios. Step 7: document clear maintenance and monitoring plans to track capacity fade over time. This iterative approach yields a sizing result that balances runtime, cost, and reliability.
The role of DoD, aging, and chemistry in capacity planning
Depth of discharge (DoD) directly affects cycle life and effective capacity. Deeper discharges generally reduce the battery’s usable energy over time, so designers often apply conservative DoD targets for longer life or more frequent cycling. Aging also reduces usable capacity, particularly in chemistries sensitive to calendar aging or temperature. When planning, it’s essential to consider how capacity fades under real-world operating conditions and to choose a chemistry that aligns with your cycling patterns. Lithium-ion chemistries, for example, may offer favorable energy density and cycle life characteristics for frequent cycling, while traditional lead-acid can be more forgiving for shallow cycles and lower upfront costs. The key is to model a representative mix of aging and usage to avoid over- or under-sizing the system over its planned lifetime.
Inverter losses, temperature, and cabling
Sizing isn’t only about the battery itself. Inverter efficiency varies with load, and temperature affects both battery performance and inverter behavior. Cabling resistance and connector losses contribute a small but meaningful portion of energy loss, especially in larger installations. Temperature rise can reduce effective capacity and alter charging rates, forcing designers to consider thermal management strategies, heat sinks, and airflow. These non-idealities often become the decisive factors when you compare two otherwise similar battery packs. A thorough analysis captures not just the nominal energy, but the real-world energy available to the load under typical operating conditions.
Case studies: off-grid solar and UPS standby
In off-grid solar scenarios, storage must bridge periods of low insolation and high demand. A properly sized battery capacity vs load combination ensures continuous operation during clouds or at night, while avoiding excessive cycling. For UPS (uninterruptible power supply) applications, the emphasis is on rapid response and short-duration high-load events, where capacity planning focuses on peak-capability and tight margin control. Both cases benefit from detailed load profiling, conservative margins, and clear maintenance plans. By contrasting these cases, engineers can see how the same sizing principles apply across different mission requirements while adjusting margins and chemistry choices to fit the duty cycle.
Common pitfalls and guardrails
Common mistakes include assuming constant load, neglecting aging effects, ignoring temperature impacts, and underestimating inverter losses. Guardrails involve validating load models with historical data, performing sensitivity analyses, and selecting a battery chemistry that supports the expected cycle life. Establishing performance targets for runtime, reliability, and safety helps ensure the final design remains robust over its intended life. Regular monitoring and recalibration of the model are valuable as actual usage diverges from predictions.
Practical checklist for engineers and technicians
- Map a realistic load profile including baseline and peak periods.
- Convert energy requirements to Wh and compare with battery capacity.
- Apply conservative DoD appropriate for the chosen chemistry.
- Include inverter, cabling, and temperature losses in the energy balance.
- Add a sizing margin for aging, forecast error, and future load growth.
- Validate sizing with scenario analysis and stress tests.
- Document assumptions, margins, and maintenance plans.
- Plan for periodic re-evaluation as equipment and usage evolve.
The evolving landscape: battery chemistries and form factors
Battery technology continues to evolve, offering trade-offs between energy density, cost, cycle life, and safety. For load-driven sizing, the choice of chemistry should reflect cycling intensity, environmental conditions, and the expected lifetime. Lithium-based chemistries often provide high energy density and favorable cycle life for frequent cycling, while nickel-based or lead-acid options may be more cost-effective for low-cycling or stationary applications. Form factor, thermal management needs, and charging/discharging rates influence how a given chemistry performs in real-world load scenarios. Staying current with industry benchmarks and manufacturer data helps engineers select a solution that balances performance with total cost of ownership.
Comparison
| Feature | Battery capacity | Load (demand) |
|---|---|---|
| Definition | Stored energy available for runtime (Wh, Ah) | Power draw the system must supply over time (W, kW) and the pattern |
| Typical units | Wh, Ah, voltage-dependent ratings | W, kW, and duration metrics for each interval |
| Sizing objective | Ensure sufficient runtime with a safe margin | Meet peak demand with reserve capacity |
| Key challenges | Degradation, temperature, and remaining capacity | Load variability, forecasting accuracy, and inverter losses |
| Best practices | Conservative capacity with aging margin and DoD considerations | Accurate load profiling and contingency planning |
Positives
- Clarifies energy sizing to prevent runtime shortfalls
- Supports cost-effective capital planning
- Improves system reliability through margin-based design
- Facilitates forecasting and maintenance planning
- Encourages standardized methodologies across projects
Cons
- Load variability can complicate sizing decisions
- Forecast errors may lead to over- or under-sizing
- DoD and aging effects require ongoing monitoring
Size capacity to meet peak load with a healthy margin for reliability
A conservative sizing approach minimizes runtime risk and avoids frequent recharging. Pair capacity planning with appropriate chemistry choices and thermal management to optimize performance over the system’s life.
Quick Answers
What is the difference between battery capacity and load?
Battery capacity is the amount of energy stored that can be delivered over time, while load is the demand the system must meet at any moment. Sizing requires aligning capacity with expected load duration and peak demand, including margins for inefficiencies and aging.
Battery capacity is the energy stored, and load is the demand. Sizing means matching energy available to how long you need it, with a safety margin.
How do you determine peak load for sizing?
Determine peak load by analyzing historical usage, simulating worst-case scenarios, and identifying the highest sustained draw during critical periods. Combine this with expected duration of peaks to guide capacity and margin decisions.
Analyze past usage to find peak demand, then simulate worst-case scenarios to size capacity.
Why is depth of discharge (DoD) important?
DoD affects cycle life and expected capacity. Deeper discharges shorten battery life and reduce usable energy over time. Design margins should reflect the chosen chemistry and desired longevity.
DoD impacts how long a battery lasts and how much usable energy you get; plan margins accordingly.
Do I need a larger capacity for intermittent loads?
Intermittent or highly variable loads benefit from a larger cushion or adaptable control strategies. Forecasting variability and including contingency capacity helps maintain reliability during fluctuations.
If your load isn’t steady, build in a cushion and use smart controls to adapt.
What role do inverters play in capacity planning?
Inverters convert DC battery energy to AC for loads, and their efficiency losses reduce usable energy. Including inverter losses in the energy balance prevents overestimation of available capacity.
Inverters matter: they add losses, so include them in your sizing calculations.
Are there guidelines for battery chemistry selection?
Choose chemistry based on cycling needs, temperature tolerance, cost, and space constraints. For frequent cycling, Li-ion options are common; for low-cost, shallow cycles, lead-acid may be viable. Align chemistry with the expected duty cycle and lifetime requirements.
Pick chemistry that matches how often you cycle the battery and the operating environment.
Top Takeaways
- Analyze peak load before sizing capacity
- Incorporate margin for aging and efficiency losses
- Account for inverter and temperature effects
- Use load profiling to forecast demand accurately
- Choose battery chemistry aligned with cycling needs