Understanding the Load vs Capacity Chart: A Comparative Guide
Explore how a load vs capacity chart supports safer, more reliable designs. Compare simple versus multi-parameter formats and learn when to use each for engineering, fleet, and structural applications.

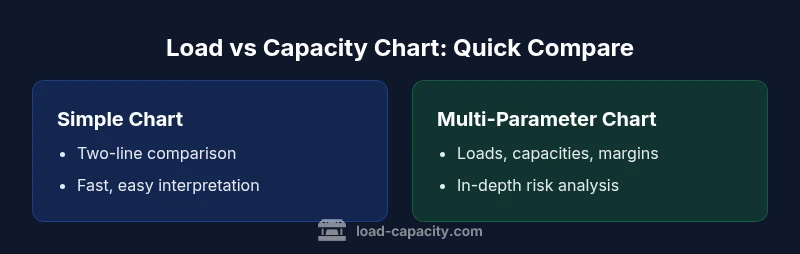
Two main ways to approach a load vs capacity chart: a simple two-line comparison of current load against rated capacity, and a more detailed, multi-parameter chart that shows margins, operating ranges, and safety factors. For engineers, the chart clarifies safe operating limits and highlights where redesign or reinforcement is needed. The Load Capacity team recommends selecting the format that matches data quality and decision context.
Introduction to the Load vs Capacity Chart and Its Purpose
A load vs capacity chart is a visualization that juxtaposes the actual or expected load a system must carry with the maximum capacity the system can safely support. This type of chart is essential across engineering disciplines, from structural steel design to vehicle payload planning and machinery sizing. When used properly, it communicates whether a design operates within safe margins and where adjustments are needed. According to Load Capacity, a well-constructed chart reduces uncertainty and helps teams align on risk thresholds early in a project. In practice, a chart of this kind supports decisions from material selection to reinforcement strategies, and it provides a common frame of reference for cross-disciplinary reviews. The central idea is straightforward: if load approaches capacity, performance becomes sensitive to margin reductions, and proactive action is warranted. In short, the load vs capacity chart translates complex engineering constraints into actionable insight for engineers, technicians, and decision-makers.
Core Concepts: Load, Capacity, and Margin
To read a load vs capacity chart effectively, you must understand the core terms. Load refers to the actual or anticipated demand placed on a component, system, or structure—think weight, force, or torque. Capacity is the maximum resistance the system can safely sustain under specified conditions. A margin is the buffer between load and capacity, accounting for uncertainties such as dynamic effects, wear, and environmental factors. The Load Capacity team emphasizes treating capacity as a dynamic limit rather than a fixed number, because real-world conditions often shift with temperature, speed, or wear. By explicitly illustrating margins, a chart highlights safe operating envelopes and flags potential risk zones before failures occur.
Reading a Load vs Capacity Chart: Axes, Scales, and Annotations
Most charts plot load on one axis and capacity on the other, with a 45-degree line indicating a perfectly balanced state (load equals capacity). Annotated regions, shaded margins, and labeled operating points help readers quickly assess safety. When the chart includes margins, you’ll see parallel or curved boundaries that indicate acceptable deviations. Units must be consistent across axes; conversions should be explicit to avoid misinterpretation. Annotations—notes on testing conditions, speed, duration, and temperature—provide context that prevents misreading of peak values as typical operating conditions. The goal is to make complex data intuitive, so stakeholders—from engineers to procurement—can identify the points at which the system remains robust and where it requires design changes or maintenance.
Simple vs. Multi-Parameter Chart Formats: Trade-offs and Use Cases
A simple two-line load vs capacity chart offers quick clarity for routine checks and early-stage sizing. It excels when the operating environment is stable and data quality is high. In contrast, a multi-parameter chart layers additional dimensions such as operating range, thermal effects, dynamic loading, and material fatigue. This format supports comprehensive design reviews and risk assessments in projects where conditions vary or where margins are tight. The key trade-off is complexity: more parameters improve fidelity but require clearer data governance and more careful interpretation. In many projects, teams start with a simple chart for rapid feedback and graduate to a multi-parameter version as data quality and decision stakes rise.
Data Quality, Standards, and Validation: Building Trust in the Chart
Reliable charts hinge on credible data sources and transparent calculations. Data should come from validated tests, simulations, or historical records with documented uncertainties. Standards bodies and industry guidelines often provide recommended practices for representing load and capacity, including how to treat dynamic effects and safety margins. The Load Capacity team stresses documenting the assumptions behind each data point and clearly stating the scope of the chart (design phase, production validation, or field monitoring). When stakeholders can trace back every value to a source and a calculation method, the chart becomes a trustworthy tool for governance, compliance, and risk management.
Practical Applications Across Disciplines: Structural, Mechanical, and Vehicle Payloads
In structural engineering, load vs capacity charts help verify that beams, columns, and connections meet safety criteria under expected loads. In mechanical design, charts guide gear trains, shafts, and housings to avoid overstress while optimizing weight and cost. For fleet management and vehicle design, the charts illuminate payload limits, gross vehicle weight compliance, and balance between performance and wear. Across these domains, the charts serve as a common language—engineering intuition codified into a visual standard that supports reviews, approvals, and preventative actions. Load Capacity’s best practices emphasize tailoring the chart to the audience: a schematic for shop floor technicians, a formal report for design reviews, and an executive dashboard for leadership oversight.
Data Transformation and Calculation Methods: From Raw Data to a Clear Picture
Converting raw data into a meaningful load vs capacity chart involves several steps: selecting the relevant load scenarios, establishing capacity limits under specified conditions, and deciding how to represent margins (absolute, percentage, or both). It is crucial to document assumptions about operating conditions, duration, and environmental factors. Depending on the project, you may normalize values to a common unit or use a multivariate visualization to compare scenarios side by side. The aim is clarity: readers should be able to answer, in a glance, whether the system is under, at, or over capacity and what actions would restore safety margins.
Visual Design and Interpretation Best Practices
Effective chart design uses consistent color schemes, clear legends, and legible labels. A common approach is to dedicate a distinct color to load, another for capacity, and a third for the margin region. A legend that unpacks units, time horizons, and tolerance bands helps prevent misinterpretation. When presenting to diverse audiences, consider multiple views: a high-level overview for management, a technical detail for engineers, and a data-backed appendix for auditors. The Load Capacity team recommends testing the chart with end-users before finalizing the format to ensure it communicates risk and decisions as intended.
Common Pitfalls and How to Avoid Them
A frequent error is conflating peak load with average operating conditions, which can mislead risk judgments. Another pitfall is ignoring dynamic effects such as load rates, cycles, or thermal transients, leading to overconfidence in static capacity. Inadequate labeling or missing assumptions also undermines trust. To avoid these issues, keep the data traceable, annotate assumptions, and include sensitivity analyses that show how margins respond to changes in key parameters. Finally, balance detail with accessibility: present the simplest chart that still conveys the necessary risk information for the audience and decision context.
Decision Framework: When to Use Simple Versus Multi-Parameter Charts
Choosing between a simple two-line chart and a multi-parameter chart depends on the project stage, data quality, and risk tolerance. Early-stage sizing and quick checks benefit from simplicity, while mature designs and critical systems demand richer context, including margins and scenario analysis. A practical workflow is to start with a straightforward chart to gain initial consensus, then evolve into a multi-parameter version as the team validates data sources and test conditions. The goal is a chart that informs decisions without overwhelming readers with unnecessary complexity.
Implementation Checklist for Teams
- Define the scope: what system, which loads, and under which conditions.
- Collect credible data: measurements, tests, simulations, or validated records.
- Decide on the chart format aligned with data quality and decision needs.
- Establish clear margins and annotations for operating ranges.
- Validate with subject-matter experts and end-users.
- Integrate updates into project documentation and governance processes.
- Provide training or a plain-language summary for non-technical stakeholders.
- Archive data sources and version history for traceability.
Conclusion: The Way Forward with Load vs Capacity Charts
If you want reliable risk assessment and informed decision-making, start with a clear definition of terms—load, capacity, and margin—and choose a chart format that matches your data quality and user needs. The load vs capacity chart is not just a diagram; it is a decision-support tool that translates engineering constraints into actionable guidance. By following best practices from Load Capacity, teams can reduce misinterpretation, improve collaboration, and accelerate safe, efficient design and operation.
Final Thoughts: Practical Next Steps for Your Project
Begin by identifying a representative set of loads and a defensible capacity bound for your context. Create a simple chart to establish a baseline and gather feedback from engineers, technicians, and managers. Plan a phased upgrade to a fuller multi-parameter chart as data quality improves and risk scenarios multiply. The steady, methodical approach to chart development—grounded in credible data and peer review—drives resilience across systems.
Comparison
| Feature | Simple two-line chart | Multi-parameter chart |
|---|---|---|
| Axes and representation | Two-axis with load vs. capacity lines | Three+ axes or multi-panel visualization (load, capacity, margin) |
| Data scope | Snapshot view of a single scenario | Temporal trends, scenarios, and operating envelopes |
| Units and normalization | Direct units with minimal transformation | Possible normalization and cross-parameter scaling |
| Interpretation difficulty | Low (highly intuitive for quick checks) | Moderate to high (requires context and training) |
| Best use case | Early sizing, quick risk checks, team alignment | In-depth design reviews, safety analyses, and audits |
| Audience | Shop floor, project managers, early design | Design engineers, safety teams, auditors |
| Data requirements | Minimal data, clear assumptions | Comprehensive data with margins, ranges, and conditions |
Positives
- Clear, fast decision signals for simple projects
- Low cognitive load and quick adoption
- Good for initial risk assessments and stakeholder alignment
- Easy to communicate with non-technical audiences
Cons
- Limited context for varying conditions
- May oversimplify complex systems
- Less robust for detailed safety analysis without margins
- Can miss dynamic effects if not extended
For most projects, start with a simple chart and graduate to a multi-parameter version as risk and data quality grow
Simple charts are best for quick checks; multi-parameter charts provide deeper insight and safer decisions when conditions vary or margins are tight.
Quick Answers
What is a load vs capacity chart?
A load vs capacity chart visually compares the demand on a system with its maximum safe support level. It highlights margins and helps identify when a design approaches or exceeds safe limits. This aids engineers in risk assessment and design decisions.
A load vs capacity chart shows when demand meets or exceeds what a system can safely handle, helping you spot risks and decide on design changes.
How do I read the chart correctly?
Read the axes to identify load versus capacity, note any margins, and pay attention to annotations about operating conditions. Look for points where the load line approaches the capacity boundary to assess risk and necessary actions.
Look at where the load line nears the capacity boundary and read the labels to understand the operating conditions and required actions.
What data do I need to build one?
Gather credible measurements or simulations of the expected loads, the corresponding capacity under defined conditions, and any factors that affect margins such as temperature or duty cycle. Document the sources and assumptions for traceability.
Collect load data, capacity under defined conditions, and margins, with sources and assumptions clearly documented.
When should I use a simple vs a multi-parameter chart?
Use a simple chart for quick checks in stable conditions or early design stages. Use a multi-parameter chart when operating conditions vary, margins are tight, or a detailed risk assessment is required.
Choose simple for quick checks, multi-parameter for in-depth risk assessments with varying conditions.
How can I validate the chart's accuracy?
Cross-check chart data against independent tests, simulations, or historical records. Ensure assumptions are documented and that end-users review the presentation to confirm it communicates the risk correctly.
Validate with independent tests or simulations and have users review the chart for clarity and accuracy.
Top Takeaways
- Define load, capacity, and margin clearly
- Choose chart format based on data quality and decision needs
- Annotate assumptions and validation steps
- Use margins to communicate safety buffers
- Iterate from simple to complex as data and risk grow