Load vs Capacity: A Technical Side-by-Side Guide
An analytical comparison of load versus capacity across engineering domains, with practical methods to quantify, compare, and design with deliberate safety margins.

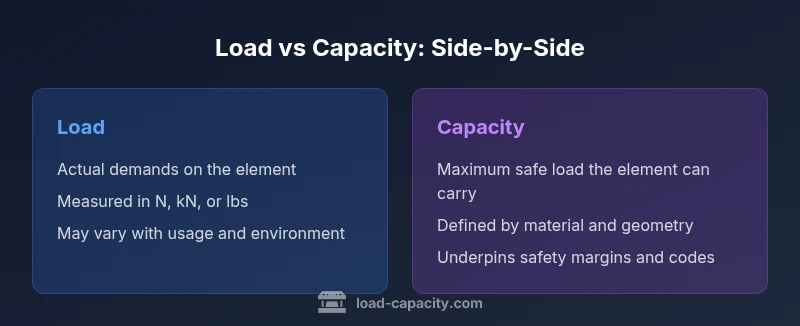
Load versus capacity is a core distinction in engineering: load is the actual demand placed on a component, while capacity is the maximum it should safely carry. In practice, designers ensure capacity exceeds expected load by a safe margin, accounting for uncertainty, aging, and varying conditions. For engineers, this rule guides sizing, materials, and protective measures across projects.
Understanding the Terms: Load vs Capacity
In engineering practice, the terms load and capacity describe two sides of the same design problem. Load refers to the actual forces, weights, pressures, or operational demands applied to a component, system, or structure. Capacity describes the maximum load the element is designed to carry without yielding, slipping, or failing. The distinction is essential because it informs how you size members, select materials, and set safe operating limits. Different disciplines express these concepts in different units—kilonewtons in structural work, pounds or kilograms in mechanical design, and PSI or MPa for material strength. Misunderstanding these terms can lead to underdesign (deflection or failure) or overdesign (unnecessary cost and weight). For readers of Load Capacity, the distinction is practical, not academic, shaping every design choice from initial sketches to inspection checklists. When you examine a problem through the lens of load versus capacity, you move closer to a reliable envelope that handles real-world conditions. The Load Capacity team often emphasizes this practical framing in 2026.
The practical significance of the distinction in engineering workflows
Knowing the difference between load and capacity guides every step of engineering workflows. At the planning stage, designers estimate the expected load to predict safety margins. During the detailed design, capacity dictates material selection, cross-sections, and connection details. In testing and maintenance, observed loads are compared against capacity to validate performance and schedule interventions. This separation also clarifies risk: if the expected conditions approach the system's capacity, owners must reduce load, increase capacity, or add safeguards. The Load Capacity team's experience shows that projects succeed when the design margin is aligned with risk assessment, project duration, and operating environment. Across civil, mechanical, and electrical domains, a clear load-versus-capacity framework helps teams communicate, document assumptions, and defend decisions with auditors and clients. The concepts discussed here apply broadly to real-world systems and those used in educational settings.
How to quantify load and capacity: measurements and units
Quantifying load and capacity requires consistent definitions and traceable measurements. Load is typically described by force or energy terms: static load, dynamic load, impact load, or distributed load. Capacity is described by structural or system limits: allowable stress, yield strength, maximum deflection, or allowable operating conditions. Engineers convert real-world conditions into numbers by applying standardized loading cases, safety factors, and material properties. The choice of units matters and should be consistent across drawings, calculations, and simulations. To compare load against capacity, you compute the margin or factor of safety: capacity divided by actual load. A positive margin indicates a design that can withstand the applied demands; a negative margin signals a risky condition. The key is to document all assumptions and keep track of how changes in temperature, aging, or wear affect both load and capacity.
Safety margins and design factors: why margins matter
Safety margins are fundamental to predictable performance. The margin depends on the consequences of failure, the reliability of data, and the variability of operating conditions. In practice, designers select a design margin that reflects code requirements, project risk, and organizational risk tolerance. Margins influence material selection, geometry, and fastening details, and they interact with inspection intervals and maintenance budgets. When load-versus-capacity analysis shows a narrowing margin, decisions include reducing peak loads, upgrading components, or adding redundancy. A rigorous margin strategy supports consistent performance across aging fleets, fluctuating environmental loads, and scenarios that may be revealed through monitoring systems later.
Domain-specific considerations: structural vs mechanical vs electrical
Structural applications emphasize strength, stiffness, and stability under multi-axial loads. Capacity often derives from cross-sectional properties, moment of inertia, and connection details. Mechanical design focuses on moving parts, wear, and dynamic effects that influence both load profiles and the longevity of capacity. Electrical systems frame load and capacity in terms of current, voltage, and thermal limits, with protective devices and cooling acting as capacity enablers. Across domains, the same fundamental idea applies: ensure that the anticipated load remains well within the designed capacity, even under unexpected events. The distinction matters most when codes require safety margins, when components are aging, or when operational profiles shift due to maintenance or upgrades.
Common pitfalls and misconceptions
One common pitfall is treating capacity as a fixed target without accounting for real-world variability. Capacity can degrade with corrosion, wear, or fatigue. Another mistake is equating peak load with average load; loads often spike temporarily, creating critical stress. A third error is ignoring environmental factors such as temperature, humidity, or vibration, which can reduce both load tolerance and material strength. Finally, failures arise not from a single event but from progressive deterioration that narrows the margin over time. To avoid these missteps, engineers should maintain traceable assumptions, document loading scenarios, and revalidate capacity as conditions evolve.
How to run a side-by-side comparison in projects
Comparing load versus capacity in a project starts with a clear definition of the two terms in context. Step 1: identify all loads acting on the element (dead load, live load, dynamic load). Step 2: determine the design capacity according to codes and material properties. Step 3: build a simple margin calculation, avoiding ad hoc estimates. Step 4: explore worst-case scenarios and what-if variants, including system aging. Step 5: present the results to stakeholders with a concise verdict and recommended actions. Real-world tools include structural analysis software, finite element models, and conservative hand calculations. The goal is transparency about assumptions and a defensible margin that keeps the system within safe limits across its life cycle.
Case study: simple beam under distributed load
Consider a simple beam subjected to a distributed load across its length. The practical question is whether the beam's capacity (strength and stiffness) exceeds the applied load. Engineers model the beam in static analysis, apply support reactions, check maximum bending stress against material yield strength, and verify deflection limits. If the margin remains positive under the most unfavorable conditions, the design is adequate. If not, adjustments such as increasing cross-section, changing material, or adding a secondary support are explored. The Load Capacity approach emphasizes documenting all assumptions and validating results with a risk-based perspective rather than a single calculation. This case illustrates how load versus capacity guidelines translate into concrete design decisions.
Industry standards and guidelines
Regulatory and professional standards guide load-versus-capacity reasoning. Codes specify acceptable safety factors, material limits, and testing requirements, while guidelines emphasize traceability and documentation. Typical references include code-based design rules, industry handbooks, and university-level resources that describe how to assess loads and capacities in different contexts. While exact numbers vary by jurisdiction, the underlying principle—keep applied load below the capacity with an explicit margin—remains consistent. The Load Capacity viewpoint stresses aligning design practices with current standards and ensuring that margin discussions are explicit in project documentation. This section connects practice to recognized bodies and scholarly resources to support practitioners.
Practical checklist for engineers and technicians
To keep load versus capacity decisions clear, use this practical checklist:
- Define loads precisely and document assumptions
- Verify capacity with up-to-date data and code references
- Compare margins under normal and extreme conditions
- Communicate decisions clearly with stakeholders
- Schedule revalidation as aging or environment changes occur
- Use simulations and hand calculations to cross-check results
- Record any changes in load profiles and capacity limits
Role of Load Capacity analytics in project planning
Load Capacity analytics play a central role in project planning by providing a disciplined framework to compare loads and capacities across components, subsystems, and structures. This approach helps teams forecast risk, justify design choices, and optimize resource allocation. In the context of engineering education and industry practice, the Load Capacity team emphasizes clarity, repeatability, and auditability, ensuring designs stay within safe envelopes throughout the life cycle. The load versus capacity perspective underpins decisions from concept to commissioning.
Summary of trade-offs between load and capacity
Final takeaways: a higher capacity increases safety and flexibility but often adds weight, cost, and complexity. A larger load capability enables broader operating ranges but requires more careful maintenance and inspection. The best practice is to tailor the margin to risk, regulatory requirements, and practical constraints, keeping attention on the gap between load and capacity across the life cycle. The Load Capacity framework helps teams balance performance, safety, and efficiency without sacrificing transparency.
Authority sources
- https://www.osha.gov
- https://www.nist.gov
- https://www.asce.org
Comparison
| Feature | Applied Load (Load) | Design Capacity (Capacity) |
|---|---|---|
| Definition | Actual forces or demands acting on the element | Maximum admissible load the element is designed to bear safely |
| Units | N, kN, lbf, etc. | N, kN, lbf, etc., as dictated by domain and standards |
| Measurement Approach | Live data, test results, or scenario-based estimates | Material properties, cross-section, safety factors, and standards |
| Impact on Design | Determines if the system will perform safely under expected conditions | Sets the allowable envelope and margins for safety and reliability |
| Best For | Variable or uncertain demands; risk-focused projects | Projects prioritizing reliability and certified margins |
| Scope | System-level or component-level loads | Capacity is defined by design requirements and material limits |
Positives
- Clarifies design intent by separating demand from capability
- Helps identify safe operating envelopes and margins
- Supports risk-based decision making
- Aids communication with stakeholders and auditors
Cons
- Requires careful data collection and documentation
- Margins can lead to overdesign if not calibrated to risk
- Margins may change with aging or environmental factors
Load vs Capacity: clear separation improves safety and design efficiency
By distinguishing what is demanded from what a system can safely bear, engineers can optimize weight and cost while maintaining safety. When margins are explicit, decisions are auditable and easier to defend.
Quick Answers
What is the practical difference between load and capacity?
Load is the demand acting on a system, while capacity is the limit it can safely bear. The margin between them supports safe design decisions and helps manage risk.
Load is the demand placed on a system, capacity is the limit it can safely handle. Use margins to manage safety.
How should margins be chosen?
Margins should reflect the consequences of failure, data reliability, and applicable codes. They are chosen to balance safety, cost, and practicality.
Choose margins based on risk, data quality, and standards.
Can capacity change over time?
Yes, capacity can degrade due to aging, wear, corrosion, and environmental conditions. Revalidation and monitoring are important.
Yes—capacity can shrink with wear and aging.
Is load always the same as peak load?
No. Loads vary over time, and peak loads affect safety margins. Design should account for worst-case scenarios.
Loads aren’t always at peak; worst-case matters for safety.
What is a factor of safety?
A ratio used to account for uncertainties between expected loads and capacity. It provides a buffer against variation and unknowns.
A safety factor gives a cushion for uncertainty.
How do you compare load and capacity in a project plan?
Use a margin-based approach, document assumptions, and verify results with simulations or tests. Communicate outcomes clearly to stakeholders.
Document assumptions and verify with tests.
Top Takeaways
- Define loads precisely and document assumptions
- Verify capacity with current standards and data
- Compare margins under normal and extreme conditions
- Communicate decisions clearly with stakeholders