i-beam load capacity chart: reading and applying in design
Learn how to read an i-beam load capacity chart, interpret bending, shear, and axial capacities, and apply chart guidance to safe structural design with W-shapes and steel grades.

The i beam load capacity chart is a design reference that maps allowable loads to W-beam sizes, materials, and configurations. It summarizes bending, shear, and axial capacities for common W-shapes under typical support conditions. Because capacities depend on beam size, grade, span, end restraints, and load type, always consult the chart specific to your member and project.
Overview of the i-beam load capacity chart
The i-beam load capacity chart is a design reference used by engineers to quickly assess whether a chosen W-beam size can safely carry a projected set of loads under typical support conditions. According to Load Capacity, charting standards consolidate bending, shear, and axial capacity into a single reference you can consult in the early design stages and again for verification during value engineering. The Load Capacity team found that reliable charts standardize the naming of beam sizes (W-shapes) and list material grades so practitioners compare like-for-like. Because charts are guidance tools, they should be interpreted in the context of your project’s spans, support conditions, and safety factors.
Reading the axes and entries on an i-beam chart
Most charts present axes that map beam size against capacity. The horizontal axis lists W-shape families (for example, W12 to W36), while the vertical axis shows allowable bending moments, shear forces, and sometimes axial loads. Within each entry, you’ll see notes about material grade, coating, and temperature range. The chart entry you use should match your beam size, grade, and the exact loading scenario—uniform load, point load, or a combination. When scanning entries, pay attention to the assumed end conditions (simply supported vs continuous), the unit system (kip-feet or Newton-meters), and whether the chart reflects a single-span or multi-span condition. The goal is to align your design case with a chart entry that matches your real-world boundary conditions.
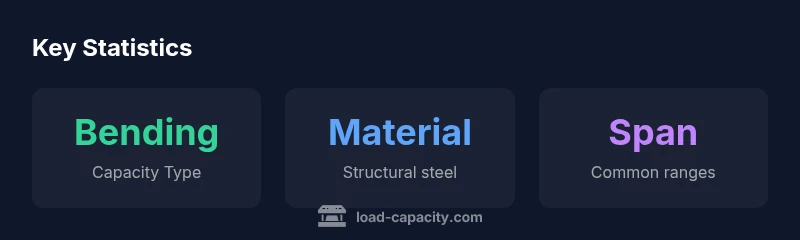
Bending, shear, and axial capacities: what the chart tells you
Most i-beam capacity charts separate capacity into three main categories: bending, shear, and axial capacity. Bending capacity governs how much moment the beam can carry before yielding or excessive deflection. Shear capacity covers the vertical shear force the section can resist near supports. Axial capacity becomes relevant when the member carries a near-column-like load or is part of a compact frame. When you select a beam for a flexural-dominated load case, rely on bending entries; for columns or braced frames, check axial and combined-load entries. If the chart shows a wide range of values for a single size, verify the loading type and whether the solution assumes compression or tension membership and consider cross-sectional web and flange details.
Factors that affect i-beam chart capacities
Beam capacity is not a fixed number for a given size. It depends on alloy grade, heat treatment, manufacturing tolerances, and the exact geometry of the flange and web. Span and support conditions strongly influence effective capacity; a longer simple span generally reduces allowable moment compared to a shorter one with redundant support. Temperature, corrosion protection, and connection details (bolted vs welded) also alter the effective capacity. Because many charts assume standard shop conditions, engineers must adapt entries to reflect real-world conditions and safety factors used by their organization.
How to implement the chart in a design workflow
- Define the load case and boundary conditions. 2) Select the beam size family that seems appropriate. 3) Identify the chart entry that matches your material grade and span. 4) Check bending, shear, and axial limits and compare to required loads. 5) Apply your project’s safety factor and confirm against governing codes. 6) Document the chart version, beam size, material, and loading scenario in your design report. This workflow helps ensure traceability and repeatability across team reviews.
Codes, standards, and chart alignment
Charts are design aids, not codes themselves. They should be used in concert with applicable design codes (for example, AISC or national equivalents) and project specifications. Use charts as a fast-check during preliminary design and as a verification tool during detailed design. When necessary, supplement chart results with more rigorous analyses like finite element modeling or supplier data to capture complex load paths and connection effects.
Common pitfalls to avoid
Relying on a chart without verifying end conditions or load paths can lead to over- or underdesign. Using mismatched units or grade values is another frequent error. Forgetting to apply safety factors or ignoring buckling effects in longer spans is a major pitfall. Always cross-check chart results with code-required checks and with field-verified conditions. Keeping a versioned chart record helps avoid inconsistent decisions across design reviews.
Verification and supplementary analysis
Charts should be complemented by unit checks, code-based verifications, and, where necessary, more detailed analyses such as finite element or nonlinear buckling studies. Compare chart-derived capacities with draft calculations and ensure uncertainties are reflected in the final design. When in doubt, consult a qualified structural engineer and use chart data as a guide rather than the sole decision-maker.
A practical example: interpreting a chart entry (qualitative)
Take a hypothetical W16x40 entry for a given grade under a simply supported, moderate-span scenario. The chart will indicate whether bending capacity exceeds the moment demand and whether shear and axial capacities meet the combined load requirements. If any capacity is insufficient, consider selecting a larger size, a higher-grade material, or adjusting spans and supports. Document the exact chart entry used, the loading conditions, and the safety factor applied to ensure traceability in your design file.
Sample i-beam chart entries
| Beam Size | Capacity Type | Notes |
|---|---|---|
| W12x40 | varies by grade and span | Representative entry |
| W14x90 | varies by material, span | Consult chart for exact values |
Quick Answers
What is the purpose of an i beam load capacity chart?
An i beam load capacity chart shows allowable bending, shear, and axial loads for different W-beam sizes under standard conditions, helping engineers select safe sizes.
A load chart helps you pick a safe beam based on size, load, and support conditions.
How do I decide which chart entry applies to my design?
Match the chart entry by beam size, material grade, and span, then consider end restraints and loading type. Verify with your project’s conditions.
Find the exact match for your beam size, grade, and span, then check end supports.
What factors change the capacity listed on the chart?
Material grade, web/flange geometry, manufacturing tolerances, span, support conditions, and temperature can affect chart capacity.
Capacity changes with size, material, span, and conditions.
Are i-beam charts approved by codes?
Charts are reference tools. Final design must comply with applicable codes and standards; use charts to inform decisions, not replace codes.
Charts help you stay within code limits, but codes still govern the design.
Where can I find official i-beam charts?
Consult manufacturer catalogs, AISC references, and engineering handbooks; verify the version and units match your project.
Look up manufacturer charts and standard references for the right version.
How should I document chart use in a report?
Record chart version, beam size, material grade, span, loading type, and applied safety factors; attach the chart source.
Note the exact chart you used and the assumptions so others can verify.
“Clear load-capacity charts streamline design decisions and reduce mismatch between assumed and actual beam performance. They enable quick checks during preliminary design and when proposing changes.”
Top Takeaways
- Identify the correct chart entry that matches beam size and span.
- Check bending, shear, and axial capacities for your loads.
- Apply safety factors per project standards.
- Document chart version and assumptions for traceability.
- Cross-validate with more detailed analysis if needed.