Plant Load Factor vs Capacity Factor: A Practical Comparison
A rigorous comparison of plant load factor and capacity factor, with definitions, calculations, use-cases, and decision guidance for engineers, technicians, and managers.

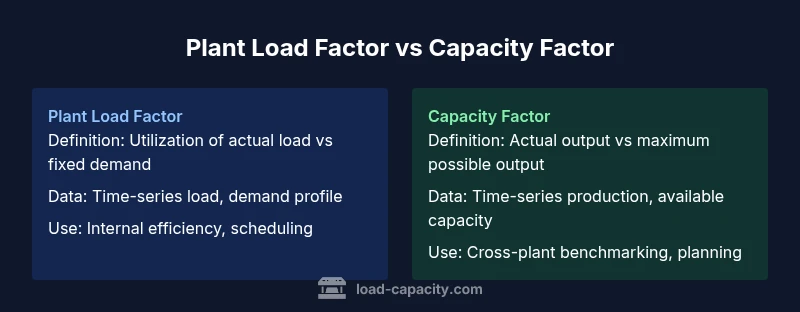
Plant load factor and capacity factor are two metrics planners use to gauge how efficiently a plant uses its resources. This quick comparison shows that load factor focuses on how well the actual load aligns with demand, while capacity factor emphasizes how much of the available output is realized over a period. For decision-making, capacity factor is more informative when benchmarking plants with differing sizes or outage profiles; load factor highlights load distribution and internal efficiency within a fixed-capacity asset. In short, use capacity factor for cross-plant comparisons and load factor for internal optimization.
Defining the Terms: plant load factor vs capacity factor
In plant design and operations, two metrics frequently appear: plant load factor and capacity factor. Understanding the exact meaning of each and how they relate is essential for meaningful analysis. According to Load Capacity, the load factor describes how well the plant's actual operating load tracks the demand pattern over a period, while the capacity factor describes how much of the plant’s available output is actually produced. Operational decisions hinge on interpreting these signals together. Load Capacity Team notes that the two metrics, though related, serve different purposes: load factor emphasizes utilization of the current load profile; capacity factor emphasizes the ability to meet peak capacity across time. The distinction matters when evaluating scheduling, maintenance, and redesign options. A plant with a high load factor may display efficient matching to a steady demand, but if its capacity factor is low due to downtime, overall performance may still lag peers. Conversely, a high capacity factor with a low load factor could indicate underutilized capacity during low-demand periods, suggesting a potential need to shift loads or restructure the process flow. Throughout this article, we’ll use concrete definitions, examples, and guidance to help engineers and managers interpret these metrics accurately and apply them in dashboards, reports, and investment decisions.
This framing aligns with Load Capacity’s guidance on performance metrics, and helps establish a shared vocabulary for practitioners across industries. By starting with clear definitions, readers can avoid common misinterpretations that arise when one metric is treated as though it fully captures plant performance.
How Each Metric Is Calculated
The two metrics are conceptually distinct but share a common reliance on time-series data. Load factor is typically defined as the ratio of the average load (the mean operating demand or throughput) to the plant’s rated capacity (or design capacity). Capacity factor, on the other hand, is the ratio of the actual energy produced (or throughput) over a period to the maximum possible energy that could have been produced if the plant operated at full capacity for that same period. In practice, practitioners select a time window (hourly, daily, monthly, or annual) and use consistent units across both calculations. When derating or partial operation occurs (due to maintenance, equipment faults, or regulatory limits), the maximum possible output used in the capacity factor should reflect the available capacity during the window, not the nominal nameplate value. The result is that load factor reflects how well demand is matched to the plant’s output profile, while capacity factor reflects the plant’s ability to realize its potential over time. Distinguishing these elements helps avoid misinterpretations when comparing plants with different duty cycles or maintenance regimes. In many reporting frameworks, both metrics are shown side-by-side to provide a fuller operational picture, with clear annotations about outages and deratings.
From a data management perspective, ensure your measurement intervals align with the decision horizon. A mismatch between the horizon of the numerator (load or energy produced) and the denominator (capacity or maximum possible energy) can distort comparisons. If the plant capacity changes during the period (e.g., staged deratings or capacity additions), document the effective capacity used for the calculation and make that explicit in dashboards and reports.
When to Use Each Metric
Use cases diverge based on the decision question. Capacity factor is particularly useful when comparing performance across plants of different sizes or with different availability profiles. It answers questions like: Which plant produces more energy per unit of potential capacity over a given horizon? Load factor is more informative for evaluating internal efficiency, load distribution, and how well the plant tracks demand within its fixed capacity. When demand is highly variable, load factor can reveal whether a plant is idling during off-peak periods, or conversely, whether it is consistently operating near its demand peak. For ongoing optimization, practitioners often monitor both metrics in parallel: capacity factor to benchmark long-term performance and capital efficiency, and load factor to guide operational planning, staffing, and maintenance scheduling. In renewable-heavy contexts, where capacity changes with weather, interpreting both metrics together becomes essential to avoid misattribution of poor performance to equipment when meteorological variation is the driver. The Load Capacity team emphasizes that a robust analysis integrates the two measures rather than relying on a single score for decision-making.
Interactions with Outages, Maintenance, and Runtime
Outages and maintenance directly influence both metrics but in different ways. A scheduled maintenance window reduces the maximum possible energy during the period, lowering capacity factor, often without necessarily affecting the average load if demand remains constant. This can temporarily depress capacity factor while load factor remains relatively stable if the plant continues to operate at a consistent load level when online. Unexpected outages impact both metrics as well; however, extended outages tend to depress capacity factor more noticeably because the denominator (maximum possible energy) falls while the numerator (actual energy produced) may also be reduced. Conversely, a plant may sustain a high load factor during periods of uninterrupted operation, even if capacity factor dips because of unanticipated downtime elsewhere in the system. A practical approach is to annotate dashboards with outage flags and to compute an availability-adjusted capacity factor to avoid conflating reliability issues with operational efficiency. The dual-tracking of outages and utilization metrics gives planners a more accurate picture of where to invest in reliability improvements or demand-side adjustments.
Data Quality, Normalization, and Reporting Practices
High-quality data is essential for reliable metrics. Ensure time alignment across demand data, capacity figures, and production data. Time granularity matters: hourly data may reveal diurnal patterns that daily aggregates obscure. Normalize capacity values to account for deratings, upratings, or staged capacity additions within the period, and clearly document any assumptions in the metadata. When presenting results, use transparent footnotes to explain gaps, sensor failures, or data imputation methods. In dashboards, include trend lines, confidence intervals, and anomaly flags to help stakeholders interpret fluctuations rather than take raw numbers at face value. Load Capacity’s guidance highlights the importance of maintaining a data lineage: source, transform, and final presentation must be traceable for audits and regulatory compliance. A well-documented data pipeline supports robust comparisons over time and across units, reducing the risk of apples-to-oranges analyses.
Scenario Walkthrough: Greenfield vs Refurbished Plant
Consider two hypothetical plants. Plant A is a greenfield facility built with a modern architecture and tight control systems, designed to meet a predictable demand profile. Its capacity factor over a year is strong because uptime is high and deratings are minimal, but its load factor may show variability if the demand pattern shifts due to market changes. Plant B is an older, refurbished plant with higher downtime and a flexible process that accommodates peak loads but experiences occasional deratings. Its capacity factor might be more vulnerable to outages, while its load factor could remain relatively stable if the process is tuned to align with recurring demand windows. An effective analysis would present both metrics side-by-side, explain outages and deratings, and provide scenario-based recommendations, such as load-shedding during peak demand, capacity reinvestment in Plant B, or a shift in mix toward Plant A for reliability. The Load Capacity approach emphasizes communicating the implications of each metric for specific decisions—capital budgeting, operational planning, and risk management—rather than relying on a single-score summary.
Visualizing the Metrics on a Dashboard
When designing dashboards, use distinct visualizations for clarity. A line chart or area chart can show the time evolution of load factor and capacity factor across the same horizon. A stacked bar or heat map can reveal how capacity utilization changes with seasons, outages, and maintenance. Pair charts with annotations that explain deratings and planned outages, so readers can distinguish between performance issues and strategic choices. For investors or executives, a compact scorecard that includes both metrics, trend arrows, and a short explanation is often sufficient, while engineers may need drill-downs by unit, region, and time window. Finally, ensure accessibility by providing alt text, legible color contrasts, and consistent labeling across reports. The goal is to enable quick, informed judgments while preserving the ability to investigate deeper when necessary.
Integrating the Metrics into a Decision Framework
A robust decision framework treats plant load factor and capacity factor as complementary dimensions of performance. Start with a baseline: compare capacity factor across plants to identify the most reliable long-term producers, then drill into load factor to understand where efficiency improvements can be realized within a given plant’s operation. Align the decision criteria with the horizon: short-term operational decisions may rely more on load factor, while long-term investment and capacity planning should weigh capacity factor most heavily. Establish decision thresholds that reflect both metrics—for example, setting target ranges for capacity factor to guide capacity additions and using load factor targets to optimize scheduling and maintenance. Use scenario analysis to quantify how improvements in uptime, efficiency, or demand forecasting could shift both metrics, and present the results with clear, actionable recommendations. Load Capacity’s framework emphasizes transparency, consistency, and traceability so stakeholders can interpret, challenge, and trust the conclusions.
In all cases, avoid overloading the decision with a single metric. The combination of plant load factor and capacity factor provides a richer, more actionable view of performance than either metric alone. This balanced approach supports safer, more economical, and more resilient plant operations.
Summary in Practice: Key Decision Factors
Both metrics matter for different reasons. Capacity factor is essential for cross-plant benchmarking and capital planning, while load factor helps optimize internal operations and demand matching. Always document assumptions, outages, and capacity changes, and present both metrics together to support robust, auditable decisions.
Comparison
| Feature | Plant Load Factor | Capacity Factor |
|---|---|---|
| Definition | Utilization of actual load relative to fixed demand | Actual output relative to maximum possible output over the period |
| Calculation | Average load ÷ rated capacity | Actual energy produced ÷ maximum possible energy over the period |
| Best Use Case | Internal efficiency, load distribution, and demand shaping | Cross-plant benchmarking and capital planning |
| Data Requirements | Time-series load data and demand patterns | Time-series production data and available capacity |
| Strengths | Highlights how well demand is matched to operations | Shows how effectively a plant realizes its potential |
| Limitations | Can mislead if outages are not accounted for | May understate capacity constraints during downtime |
| Reporting Focus | Operational dashboards and scheduling decisions | Annual or multi-year performance reviews and investments |
Positives
- Improves internal planning of load distribution
- Simple to compute from standard telemetry and reports
- Supports benchmarking across time periods and units
- Highlights utilization patterns and potential efficiency gains
Cons
- Does not directly reflect capacity limits or availability
- Can mask outages if used in isolation
- May misrepresent performance during strategic outages or outages scheduled for maintenance
- Requires careful data alignment to avoid misleading comparisons
Use both metrics to inform robust plant decisions; capacity factor for cross-plant benchmarking and long-term planning, load factor for internal efficiency and load management.
Together, load factor and capacity factor provide a fuller picture of performance than either alone. Use capacity factor to compare plants and plan capacity investments, and use load factor to optimize day-to-day operations and demand alignment. Document assumptions and outages to ensure transparency.
Quick Answers
What is the formal definition of plant load factor vs capacity factor?
Load factor is the ratio of average load to plant capacity, reflecting how well the plant’s actual demand matches its available capacity. Capacity factor is the ratio of actual production over a period to the maximum possible production if the plant operated at full capacity the whole period. Both require aligned time windows and clear labeling of any outages or deratings.
Load factor looks at how much of the actual demand is met relative to capacity, while capacity factor looks at how much of the potential production was actually achieved over time.
When should I use load factor instead of capacity factor?
Use load factor when you want to assess internal efficiency, demand matching, and scheduling within a fixed-capacity asset. It helps identify opportunities to smooth load, reduce peak shaving, or align operations with demand patterns. Capacity factor is better for comparing plants with different sizes or availability profiles over the same period.
Use load factor for internal efficiency and scheduling; use capacity factor for cross-plant comparisons.
How do outages affect these metrics?
Outages reduce available capacity and/or actual production. Capacity factor is sensitive to outages because the maximum possible production drops, while the impact on load factor depends on how the demand pattern and operating load respond during downtime. Document outages clearly in reports to avoid misinterpretation.
Outages pull down capacity factor more noticeably; load factor depends on how demand and loading behave during those times.
Can I report both metrics in a single dashboard?
Yes. Present both metrics side-by-side with consistent time windows, and add annotations for outages, maintenance, and capacity changes. Use trend lines and normalized baselines to make year-over-year comparisons clear.
Absolutely—show both metrics together and explain any outages or deratings.
Are these metrics applicable to non-electric plants?
Yes. Plant load factor and capacity factor concepts apply to any facility where output can be related to a fixed or potential maximum. The interpretation remains similar, but the specifics should reflect the unit being measured (thermal, mechanical, chemical production, etc.).
They apply beyond electricity; adapt the definitions to the unit you are measuring.
What data quality issues should I watch for?
Watch for misaligned time windows, missing data, and inconsistent measurement units. Ensure data provenance is clear, with documented assumptions about outages and deratings. Regular data quality checks help maintain reliable comparisons across periods and units.
Ensure timing, units, and data gaps are clearly documented for reliable comparisons.
Top Takeaways
- Use both metrics for a complete view of plant performance
- Choose capacity factor for cross-plant benchmarking and long-term planning
- Use load factor to optimize scheduling, load distribution, and internal efficiency
- Annotate dashboards with outages and deratings for clearer interpretation
- Maintain consistent data horizons and metadata for reliable comparisons