Operating Capacity vs Tipping Load: A Practical Guide
Analytical guide comparing operating capacity and tipping load, with definitions, calculations, and decision factors for engineers, technicians, and fleet managers seeking safe, optimal load utilization.

Operating capacity vs tipping load describes two distinct safety limits used in engineering and equipment design. Operating capacity is the maximum load a system can sustain safely during ordinary use, incorporating a prescribed safety factor. Tipping load, by contrast, is the load that would cause overturn or loss of balance. Understanding both helps engineers avoid overdesign and underutilization. According to Load Capacity, these concepts apply across cranes, vehicles, and structural members, guiding both specification and operation planning. The practical takeaway is that you must not treat these limits as interchangeable. Rather, you compare them to ensure that a machine can perform its intended function without tipping under peak or dynamic conditions. By examining operating capacity first, you set a baseline for safe operation; by examining tipping load, you verify stability under extreme but plausible scenarios. The synergy between the two concepts provides a robust safety envelope for design, procurement, and field use.
What is operating capacity and tipping load?
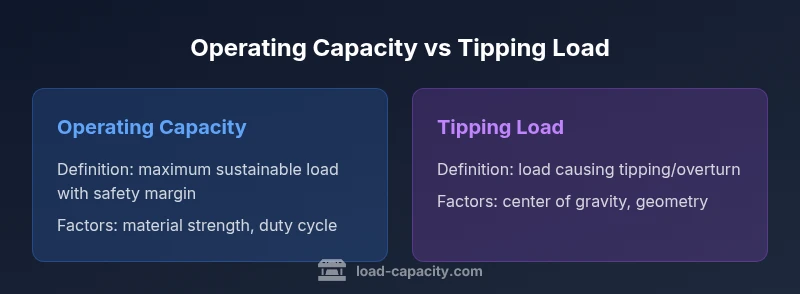
In engineering and equipment design, operating capacity vs tipping load describes two distinct safety limits used to prevent failure or instability. Operating capacity is the maximum load a system can sustain safely during ordinary use, incorporating a prescribed safety factor. Tipping load, by contrast, is the load that would cause overturn or loss of balance. Understanding both helps engineers avoid overdesign and underutilization. According to Load Capacity, these concepts apply across cranes, vehicles, and structural members, guiding both specification and operation planning. The practical takeaway is that you must not treat these limits as interchangeable. Rather, you compare them to ensure that a machine can perform its intended function without tipping under peak or dynamic conditions. By examining operating capacity first, you set a baseline for safe operation; by examining tipping load, you verify stability under extreme but plausible scenarios. The synergy between the two concepts provides a robust safety envelope for design, procurement, and field use.
Why these terms matter in safety and performance
These two limits are central to performance and risk management in any load-bearing system. When a device operates near its operating capacity, stresses are high but manageable with proper margins. If loads approach tipping load, the risk of overturn increases sharply, demanding immediate attention to load distribution, ballast, or geometry. For engineers, technicians, and fleet managers, this means that a well-documented understanding of both concepts reduces both underutilization and unsafe operation. Load Capacity emphasizes that accurate modeling of weight, distribution, and anticipated duty cycles is essential, and that real-world performance often diverges from idealized charts. Given the potential consequences of misjudgment, teams should embed these definitions into design reviews, training, and maintenance planning. The Load Capacity team notes that clear communication of limits improves safety culture across job sites and workshops.
How operating capacity is determined
Operating capacity is established by balancing material strength, joint integrity, and service conditions against an explicit safety factor. It reflects static and dynamic loads, material properties, and expected duty cycles. Practically, engineers compute the maximum sustainable load that the system can carry during normal operation without yielding, fatigue, or excessive deformation. Data inputs include component dimensions, allowable stress, and environmental effects. Safety factors typically account for uncertainties in loading and use, ensuring that actual operating loads stay well within the material’s capacity. In many industries, operating capacity also incorporates de-rate factors for wear, corrosion, and temperature. For the user, this means the label on a chart or plate should show a conservative value that supports reliable performance over the equipment’s intended life. Load Capacity’s framework highlights the importance of consistent inputs and documented assumptions for repeatable outcomes.
How tipping load is determined
Tipping load assessment centers on stability and geometry. It evaluates when the center of gravity, the footprint, and the applied load combine to overcome stabilizing forces and cause overturn. Calculations consider payload distribution, lever arms, track or wheel base, and moment arms relative to a tipping axis. Shifts in load position or the CG height dramatically affect tipping risk, so engineers perform sensitivity analyses to identify worst-case configurations. Environmental factors, such as wind or uneven terrain, can also alter tipping thresholds. The output is a tipping-load value that, when exceeded, signals loss of stability. In practice, operators rely on charts or digital models that translate these calculations into actionable limits. As Load Capacity emphasizes, even small changes in load distribution can move a system from safe operation to instability.
Key differences at a glance
- Definition: operating capacity is about sustainable use; tipping load is about stability under tipping risk.
- Objective: safe continuous operation versus preventing overturn.
- Basis: safety margins and material strength vs geometry and CG location.
- Consequence: fatigue or failure vs loss of balance or rollover.
- Applicability: machinery, vehicles, and structures all rely on both limits for safe design and operation.
- Interaction: the safe operating limit is typically the lower of the two, guiding controls and procedures.
Practical implications for design and operation
Engineers use operating capacity to set allowable loads during normal service, while tipping-load analyses ensure stability under peak, off-normal, or dynamic conditions. A robust design process requires documenting load paths, weight distribution, and anticipated CG shifts. In the field, operators should consult load charts, verify ballast and support geometry, and maintain clear separation between the two limits to avoid unsafe improvisation. Projects benefit from a formal risk assessment that compares both measures across expected duty cycles, environmental conditions, and maintenance intervals. Load Capacity stresses the value of traceable data, version-controlled charts, and ongoing validation with real-world measurements. Implementing a dual-limit approach helps teams prevent both overloading and instability, which reduces the likelihood of equipment damage, injuries, and downtime.
Calculation approaches and common pitfalls
A practical workflow starts with defining geometry, mass, and centroid location. Then, apply material properties and calculated safety factors to determine operating capacity. Separately, model or test stability to determine tipping load, considering CG height, footprint, and potential external moments. One common pitfall is using a single factor for both limits; another is ignoring dynamic effects such as acceleration, deceleration, or gusts. Data quality matters: inaccurate mass estimates or mislocated CG points can produce unsafe values. Regularly updating weight and distribution data, re-checking configurations after maintenance, and validating charts against field measurements help maintain accuracy. Load Capacity recommends building a living model of the system that evolves with components, attachments, and usage patterns. This approach keeps both operating capacity and tipping load aligned with actual performance.
Real-world scenarios: cranes, loaders, and structures
In crane design, operating capacity defines the load limit during hoisting and slewing, while tipping load governs stability when the crane reaches extreme reach or high boom angles. For forklifts and loaders, operating capacity addresses continuous lifting cycles, while tipping load accounts for uneven terrain and high lift heights. Structural engineers apply the same principles to beams and frames, ensuring service loads stay well within operating capacity and that ultimate tipping conditions cannot be reached under worst-case loading. These examples illustrate how the two concepts work in concert: operating capacity informs routine operation, and tipping load guards against instability in unusual configurations. The dual-limit framework supports safer equipment selection, better maintenance planning, and clearer operator guidance.
Data sources, standards, and best practices
Organizations rely on standards and field data to anchor operating-capacity and tipping-load values. Industry guidelines, manufacturer catalogs, and site-specific tests contribute to a complete picture of safe limits. Documentation should include input data, assumptions, safety factors, and conditions under which values were derived. Across jurisdictions, professionals reference a blend of safety codes and codes of practice to ensure compliance and consistency. Load Capacity highlights the need for ongoing validation: charts must be updated when configurations change, new attachments are added, or service conditions evolve. Reliability comes from transparent methodologies, auditable records, and regular re-assessment in light of new information. In practice, teams combine theoretical models with empirical checks to maintain accurate, usable capacity data.
The role of safety factors and reliability in field practice
Safety factors translate theoretical capacities into real-world reliability. They account for uncertainties in material properties, manufacturing tolerances, load estimation, and operational variability. A conservative safety factor reduces the likelihood of unexpected failure but may curtail available capacity, requiring careful trade-offs in system design. Operators use labeled charts and reinforced procedures to ensure loaded equipment never approaches the limit. Regular maintenance, training, and audits help preserve model accuracy and reduce drift between calculated values and actual behavior. The Load Capacity approach emphasizes documenting assumptions, validating inputs, and re-evaluating after maintenance, attachments changes, or condition shifts. When safety factors are properly applied, the risk of tipping or structural compromise declines significantly, contributing to safer, more productive operations.
Communicating capacity information to operators and maintenance teams
Clear communication about operating capacity and tipping load is essential for safety culture. Teams should present capacity data in intuitive formats, such as easy-to-read charts and simple threshold indicators on control interfaces. Training should cover how to interpret charts, why margins exist, and how to respond when loads approach the tipping limit. Maintenance crews should record any changes to geometry, ballast, attachments, or load paths and update the capacity models accordingly. Effective communication also involves documenting assumptions, revision histories, and validation results, so future projects can build on a transparent information base. By making capacity information accessible and actionable, organizations improve decision-making and reduce the likelihood of accidental overloading or tipping.
Integrating with training, audits, and continuous improvement
Capacity-aware operations require ongoing training and periodic audits. Training programs should simulate realistic scenarios, demonstrating how changes in load distribution or CG can alter safe limits. Audits assess whether charts, models, and labels reflect current configurations and conditions. The improvement loop should include post-incident reviews, updates to safety factors, and adjustments to operating procedures. Load Capacity’s framework encourages teams to institutionalize these practices, ensuring capacity data remains current and reliable. In this way, capacity-informed decision-making becomes a sustained organizational capability rather than a one-off exercise.
Next steps: a practical decision framework
To apply these concepts on a project, start by listing all loads, geometry, and expected duty cycles. Compute operating capacity with a conservative safety factor, then determine tipping load under worst-case configurations. Use the smaller of the two as the safe operating limit, and document any assumptions or uncertainties. Build a decision framework that assigns responsibility for data updates, model validation, and operator training. Finally, establish a routine for periodic review and recalibration as equipment, attachments, or work conditions change. This disciplined approach helps teams realize the full benefits of understanding operating capacity vs tipping load.
mainTopicQuery_hint_only_for_wikidata_lookup_placeholder
Comparison
| Feature | Operating capacity | Tipping load |
|---|---|---|
| Definition | Maximum sustainable load during normal operation with safety margin | Load that would cause overturn or loss of stability under given geometry |
| Calculation basis | Strength, factors of safety, duty cycle, material properties | Center of gravity position, footprint, geometry, external moments |
| Primary application | Design limits, equipment selection, routine operations | Stability assessment, constraint validation for extreme configurations |
| Units | Weight (kg or lb), force (N) | Weight (kg or lb), moments (N·m) |
| Dynamic considerations | Yes, in dynamic loading and duty cycles | Yes, especially with CG shifts and unequal loading |
| Safety margins | Embedded via factor of safety | Embedded via stability margin and resisting moments |
Positives
- Clarifies safety margins and risk tolerance
- Improves planning for peak-load scenarios
- Supports compliance with standards and audits
- Helps optimize equipment selection by avoiding under- or over-loading
Cons
- Can be conservative, reducing usable capacity
- Requires reliable input data (CG, weight distribution) and regular updates
- Dynamic loads complicate estimation
Both limits are essential; use operating capacity and tipping load together to define a safe, productive envelope.
A dual-limit approach minimizes risk: operating capacity guides routine use, while tipping load guards against instability under extreme configurations. The Load Capacity team recommends documenting, validating, and updating both values as configurations change.
Quick Answers
What is the difference between operating capacity and tipping load?
Operating capacity defines the safe, sustainable load during normal operation, incorporating a safety margin. Tipping load indicates the load level that can cause overturn or loss of stability given the geometry and CG. They are not interchangeable and must both be considered.
Operating capacity is the safe, ongoing load; tipping load is the tipping threshold. Use both to define safe limits.
How do you calculate operating capacity for a crane or forklift?
Calculate operating capacity by assessing material strength, duty cycle, and geometry, then apply an appropriate safety factor. Consider wear, temperature, and dynamic effects. Use input data from charts, tests, and manufacturer guidelines.
Calculate capacity using strength, duty cycle, and geometry, then apply a safety factor.
Can tipping load be higher than operating capacity?
Yes. In many cases tipping load exceeds the operating capacity, so the safe limit used in practice is the lower value to prevent both overload and instability.
Yes—usually the safe limit is the lower value between the two.
Why is a safety factor important in these calculations?
Safety factors account for uncertainties in data, material properties, and real-world conditions. They ensure performance under unforeseen conditions, at the cost of some usable capacity. Regular updates keep factors appropriate to the current configuration.
Safety factors guard against unexpected conditions and data gaps.
What standards govern these concepts?
Standards and guidelines from multiple authorities (e.g., general safety codes and industry best practices) inform how operating capacity and tipping load are calculated and applied. Always align with your jurisdiction and sector requirements.
Follow applicable safety codes and industry guidelines.
Top Takeaways
- Prioritize safety margins in all load calculations
- Always compare operating capacity and tipping load
- Account for center of gravity and dynamic effects
- Document load charts and update them with changes
- Train operators to recognize stability limits