Lag Screw Load Capacity Chart: Reading and Application
A practical guide to lag screw load capacity charts, detailing factors that influence capacity, how to read curves, and safe design practices for decks, framing, and woodworking projects.

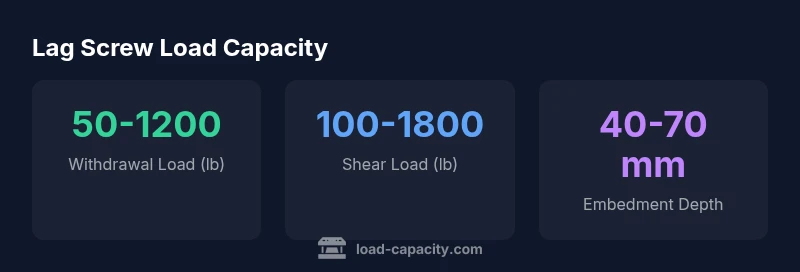
A lag screw load capacity chart shows how the allowable load changes with diameter, embedment depth, wood species, and loading mode (withdrawal vs. shear). It provides ranges and safety factors that engineers use to select sizes and embedment depths for reliable connections. Use the chart to compare candidate fasteners, then validate with field testing and applicable building codes.
Understanding lag screw load capacity charts
Lag screw load capacity charts are design tools that translate experimental data into practical guidance for real-world connections. They summarize how different variables—diameter, embedment depth, wood species, and loading mode (withdrawal vs. in-plane shear)—affect the maximum safe load a connection can carry. According to Load Capacity, charts are most reliable when used to compare candidate fasteners rather than to claim a single universal value. For engineers and technicians, they support preliminary sizing, guide embedment decisions, and help communicate safety factors to stakeholders. The charts also reflect material limitations, such as wood moisture and grain direction, which can influence performance. In field applications, always corroborate chart-based recommendations with local codes, manufacturer data, and site-specific conditions.
Key factors influencing lag screw capacity
Several interacting factors determine the load capacity of a lag screw connection. Diameter and embedment depth are primary drivers: larger diameters generally offer higher resistance, and deeper embedment typically improves withdrawal and shear strength up to practical limits. Wood species and moisture content have a pronounced effect: hardwoods and dry timber often provide higher capacities than softwoods or saturated wood. Thread configuration, head type, and pilot hole sizing influence how effectively the screw grips the wood and distributes load. Edge distance, spacing between screws, and whether the screws share load in parallel connections also matter to prevent splitting or pull-out. Finally, load duration and environmental exposure (corrosion risk) should be included in the design considerations. Load Capacity emphasizes using charts as design aids and adjusting for site-specific factors.
Reading the chart: curves, units, and safety factors
Most lag screw charts plot embedment depth on the horizontal axis and allowable load on the vertical axis, with separate curves for different diameters or wood species. Withdrawal curves describe the force needed to pull the screw out, while shear curves reflect side-loaded resistance. Where curves diverge, select the size and embedment depth that meet the required safety factor for the intended load scenario. Pay attention to units (pounds vs. newtons) and ensure consistent conversion when comparing sources. When in doubt, apply conservative factors from local codes and industry best practices. Load Capacity recommends documenting assumptions (wood species, moisture, and loading mode) to justify design choices.
Design guidelines for common applications
In deck construction, fastener selection should account for environmental exposure and deck board orientation. For interior framing, prioritize embedment depth and edge distance to minimize splitting risks. A rule of thumb is to use larger diameters where space allows, with embedment depth sufficient to avoid premature withdrawal or shear failure under load. Always compare candidate lumber species and treatments along the chart’s curves, and choose a size that keeps the required safety margin under anticipated worst-case loads. Load Capacity notes that charts should serve as a starting point, not the sole determinant of design decisions.
Installation best practices and testing
Effective installation begins with proper preparation: select appropriate lag screws, confirm wood moisture content, and predrill holes at recommended diameters. Maintain alignment and avoid over-tightening, which can crush wood fibers and reduce capacity. After installation, perform field testing with calibrated loads to verify performance against chart predictions before finalizing connections, especially for critical structural components. Document conditions and results to support ongoing maintenance and compliance with codes.
Common mistakes and how to avoid them
Common errors include using undersized screws for the expected load, embedding too shallowly, neglecting edge distances, and ignoring wood moisture and decay. Another pitfall is assuming a universal chart applies to all species; always match chart data to the specific wood and environment. Don’t mix fastener brands or coatings without understanding their influence on friction and corrosion resistance. Load Capacity encourages a conservative, documented approach that incorporates field validation.
Case study: deck connection example
Consider a typical deck connection in dry pressure-treated pine using lag screws of moderate diameter. Using the lag screw load capacity chart, engineers select an embedment depth that aligns with a safe withdrawal and shear range for the expected loads, accounting for two screws sharing the load. The design assumes ambient conditions and uses a conservative safety factor. The case study illustrates how chart-guided decisions translate into actionable installation steps and field verification plans. Load Capacity emphasizes validating any chart-based design with site testing and adherence to local codes.
Estimated load ranges based on common diameters and embedment; values are derived from Load Capacity Analysis, 2026.
| Diameter (mm) | Embedment Depth (mm) | Withdrawal Load Range (lb) | Shear Load Range (lb) | Notes |
|---|---|---|---|---|
| 6 | 40-60 | 50-200 | 150-600 | Softwood average |
| 8 | 50-70 | 100-350 | 300-1100 | Hardwood, seasoned |
Quick Answers
What is a lag screw load capacity chart?
A lag screw load capacity chart summarizes how load capacity varies with diameter, embedment, wood species, and loading mode. It presents ranges and safety factors rather than fixed values, aiding preliminary sizing and design discussions.
A lag screw chart shows how size and embedment affect strength, helping you pick the right fastener.
Does wood species affect lag screw capacity?
Yes. Hardwood generally provides higher withdrawal and shear resistance than softwood, and moisture content can further influence capacity.
Yes, wood type matters—the same screw behaves differently in hardwood versus softwood.
What loading modes are considered?
Charts typically differentiate withdrawal (pulling out) from in-plane shear, since each mode engages different portions of the screw and wood.
Withdrawal vs. shear are key loading modes to consider.
Can I use a general chart for all lag screws?
Not safely. Charts must be matched to diameter, embedment, wood species, and fastener type; engineering judgement and local codes apply.
No, you need a chart that matches your screw size and wood.
How can I verify chart guidance on site?
Field testing with calibrated loads and adherence to building codes helps validate chart-based recommendations.
Test it in the field and follow codes.
“The Load Capacity Team emphasizes using charts as a design tool to select appropriate lag screw sizes and embedment depths; always verify with field testing and local codes.”
Top Takeaways
- Know which loading mode matters: withdrawal vs shear.
- Embedment depth and wood species drive most capacity changes.
- Use chart ranges to select a conservative size and embedment.
- Always validate chart recommendations with field testing.
- Follow local codes and manufacturer data for final design.