Tire Load Capacity Chart: Reading, Interpreting, and Applying for Safe Loads
A practical guide to tire load capacity charts, including how to read load index, inflation, and per-tire limits, and how to apply them to safe vehicle loading for engineers, fleet managers, and DIYers.

Tire load capacity charts translate the maximum load each tire can safely carry at specific inflation, tire size, and speed into actionable limits for vehicle loading. They help you assign payload across axles without exceeding per-tire or per-axle constraints. According to Load Capacity, always cross‑check tire charts with the vehicle manufacturer data to ensure accuracy and safety.
Understanding tire load capacity charts and their purpose
According to Load Capacity, a tire load capacity chart translates the technical specifications stamped on tires and on vehicle data plates into a practical safety limit for daily operation. For engineers and technicians, these charts are a planning tool that helps allocate payload across axles without exceeding per-tire or per-axle limits. A chart combines tire size, load index, inflation recommendations, and vehicle configuration to yield a maximum safe load figure per tire. When used correctly, charts support safer loading strategies, reduce the risk of tire failure, and extend service life by avoiding sustained overloading. In fleet work, reliable charts align maintenance planning with actual mission profiles, from long highway runs to heavy-duty job sites. Load Capacity emphasizes that charts are only as good as the data behind them, and should be cross-checked with official OEM data.
Key terms you'll encounter on tire load charts
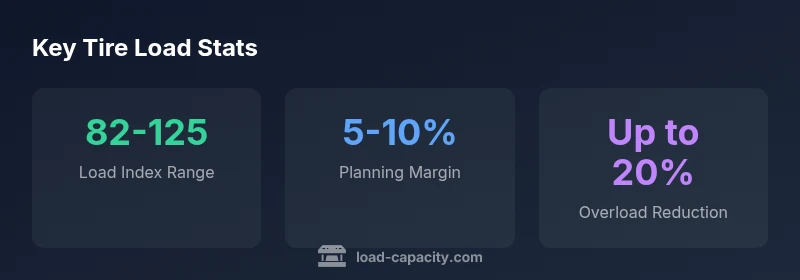
To read a tire load capacity chart effectively, you need to understand several terms that repeat across manufacturers’ documents. Load index is the numeric code that denotes maximum load per tire at a specified speed. The maximum load per tire is the weight a single tire can safely carry when inflated to the recommended pressure. Inflation pressure is critical because under- or over-inflation shifts load distribution and tire contact patch. Tire size and type (P-metric, LT, or others) determine the baseline capability; larger, heavier tires carry more load but require matching rims and suspension considerations. Axle load and gross vehicle weight are the two central planning constraints; the chart helps you distribute total payload among tires to avoid exceeding either limit. Finally, speed rating and duty cycle matter when high-speed operation or repeated stop–start cycles are involved, since these factors influence safe operating load over a trip.
How to read a tire load capacity chart: step-by-step
Start by locating the tire size on the chart, then note the corresponding load index and the recommended inflation pressure. Next, identify the number of tires on each axle and multiply the per-tire load by that count to obtain axle and gross per-axle loads. Compare these figures against the vehicle manufacturer’s axle load limits, which may be published in the owner’s manual or a vehicle specification sheet. If your calculated loads approach the chart’s maximum or exceed the OEM limits, you must reduce payload, distribute weight more evenly, or select tires with a higher load rating. Always verify that the chart’s parameters (temperature, altitude, and speed rating) match your operating conditions. Finally, record the specific chart values you plan to use and store them with maintenance records for future reference.
Applying charts to different vehicle types: cars, SUVs, and light trucks
Passenger cars usually have lighter per-tire loads and more uniform axle distributions, so chart values are often straightforward to apply. SUVs and light trucks introduce heavier duty tires and sometimes more diverse load scenarios due to cargo and towing. In these cases, the chart often shows a wider range of acceptable loads per tire depending on the tire model and inflation. For trailers, many charts require separate considerations, as axle configurations and hitch weight create distinct load paths; never assume a chart for a vehicle applies directly to a trailer without verification. The key principle is to match tire type, size, and load rating with the expected payload, and to respect the axle’s allowable distribution. Load Capacity notes that consistent data sources and manufacturer guidance should guide any adjustments.
The role of inflation and temperature in load capacity
Inflation pressure directly impacts the amount of load a tire can carry safely. Underinflation reduces the tire’s effective load-bearing area and can cause overheating under normal driving, especially during heavy loads or hot weather. Conversely, overinflation can reduce the contact patch and handling, increasing the risk of rim impact and uneven wear. The chart’s recommended inflation values assume standard ambient temperatures; deviations from these conditions require rechecking the chart or OEM guidance. Temperature affects tire pressure; a rise in ambient temperature can increase internal pressure, while cold starts reduce it. When planning loads, consider seasonal temperature changes and adjust inflation per the tire manufacturer’s chart, not by feel alone. Even with correct inflation, sustained high-load operation can degrade tire performance; regular inspection and maintenance remain essential.
Real-world scenarios: planning payloads with charts
Imagine a delivery van with four identical tires rated to a maximum load per tire; you must ensure the total payload does not exceed the sum of the four tire limits minus reserve for safety margins. In another case, a work crew loads tools and materials into a midsize truck; using the tire chart helps allocate heavier items toward the rear axle if permitted by the tire ratings and wheel load distribution. For trailer operations, calculate the tongue weight, axle loads, and verify that each tire’s maximum load remains within range. If necessary, distribute weight to balance traction and steering control. In all cases, keep a conservative buffer (for example, using 80-90% of the chart’s listed maximum) to accommodate dynamic road conditions and measurement uncertainties.
Safety considerations and common mistakes to avoid
Common mistakes include using a chart for a different tire size, loading beyond the per-tire or per-axle limits, and failing to account for dynamic loads during acceleration, braking, and cornering. Another frequent error is neglecting the impact of temperature and weather on tire pressure and load capacity. Always ensure the vehicle’s gross vehicle weight and axle ratings align with the chart values, and choose tires with adequate load ratings for the intended duty cycle. Regular maintenance checks, including tire pressure monitoring, wheel torque, and tread depth, help sustain the reliability of load capacity calculations. When in doubt, consult the OEM documentation or a qualified engineer.
Tools, resources, and best practices to verify loads
Tools include OEM charts, credible third-party tables, and fleet-management software that stores tire load data for each vehicle. Best practices involve updating payload calculations whenever tire replacements occur, using the highest available load rating for challenging duties, and documenting all changes in maintenance records. For verification, cross-check chart numbers with the vehicle’s data plate and owner’s manual; if discrepancies arise, contact the tire manufacturer or vehicle OEM. Load Capacity suggests creating a standard operating procedure for load verification to reduce human error and improve safety. Additionally, use official references such as regulatory agencies and industry standards bodies when applicable.
The future of tire load charts: dynamic loads and evolving standards
As vehicle dynamics and tire technology evolve, load charts are adapting to include dynamic loading scenarios, towing configurations, and new tire designs for electric vehicles. Dynamic loading takes into account accel/brake forces, cornering grip, and drivetrain torque that influence real-world load distribution. Standards bodies are updating guidelines to reflect these changes, and manufacturers may publish updated charts with expanded size ranges and higher load indices. For engineers, this means staying current with OEM updates and industry references, and integrating data from load charts into Fleet Management and risk assessment processes. The Load Capacity team recommends ongoing education and proactive data validation to maintain accurate, durable load planning.
Summary of tire load chart components
| Aspect | What it means | How to use it |
|---|---|---|
| Load Index | Numeric value indicating max load per tire | Match with vehicle/axle load |
| Max Load per Tire | Weight a single tire can carry safely | Do not exceed this when planning axle loads |
| Inflation Pressure | Recommended PSI at specified load | Adjust only as per manufacturer chart |
| Tire Size/Type | P-metric, LT, etc | Different sizes have different loads and speeds |
Quick Answers
What is a tire load index and how does it relate to a chart?
The load index is the numeric code that indicates the maximum load a tire can support at the specified speed and pressure. On charts, you match the tire's load index to the vehicle's needs and ensure the combined axle loads stay within limits.
The load index tells you how much weight a tire can carry. Check the chart and the vehicle specs to stay within safe limits.
Can I use a chart intended for passenger tires on light trucks?
Charts are size- and type-specific. Do not apply a passenger-car chart to a light-truck tire; instead reference the chart for that tire size and type, and verify with OEM data.
Use charts that match your tire type and size; mixing charts can mislead you.
What should I do if the chart shows a load beyond my axle limits?
If limits are exceeded, reduce payload, upgrade tires, or use tires with a higher load rating. Confirm with the vehicle manufacturer and consider distributing loads across axles.
Don’t exceed axle limits; adjust payload or tires to bring loads into safe range.
Are spare tires included in load calculations?
Spare tires are generally not included in regular axle load calculations unless specified by the OEM or used as a part of the same axle in a load test.
Spare tires may not count toward axle load unless your OEM says so.
How often should load charts be updated?
Update cycles depend on manufacturer and standards bodies; typical updates occur when new tire models are released or standards change.
Charts get updated with new tires; check for updates when you acquire new tires.
“Tire load capacity charts are only as good as the data behind them; always cross-check with vehicle manufacturer guidance and tire maker specs for safe operation.”
Top Takeaways
- Verify loads against OEM limits before loading
- Read load index and inflation per chart
- Cross-check axle distribution for real-world loads
- Avoid mixing tires with different load ratings on an axle
- Use conservative margins to prevent overload