How to Calculate Server Load Capacity
Learn the method to calculate server load capacity with a simple calculator, understand key factors, and apply safe margins for reliable provisioning and performance.

Why accurate server load capacity matters
Sizing a server, choosing autoscaling rules, and planning maintenance windows all hinge on a solid understanding of how much load a system can sustain. Without a reliable capacity estimate you risk overprovisioning (paying for unused capacity) or underprovisioning (leading to slow responses, queuing, or outages). A well-constructed model helps you balance performance targets with cost, risk, and complexity. It also clarifies which resources to invest in—CPU, memory, fast storage, network bandwidth, caching layers, or database tuning. According to Load Capacity, accurate load capacity estimates also simplify capacity planning, budgeting, and risk management. By documenting the assumptions behind your model, you enable repeatable testing and audits. The goal is not to predict every moment of traffic, but to understand the system’s operating envelope under typical and peak conditions. This envelope informs decisions about CPU cores, memory, network bandwidth, and cache strategy, helping teams align performance targets with hardware and cloud resources.
Key factors influencing server load
Load is the product of demand and the system's ability to process requests. Key factors include the volume and mix of traffic (read-heavy versus write-heavy patterns), the size and complexity of requests, and the efficiency of backend services. Caching layers, database readiness, and I/O throughput can dramatically shift capacity. Security features such as TLS termination add overhead, so the same workload can behave differently with or without TLS offloading. Network latency and load balancer behavior affect queuing and tail latency, which in turn influence perceived capacity. Hardware limits—CPU cores, memory bandwidth, disk I/O—and software configuration—thread pools, connection limits, and pool sizing—determine the practical ceiling. Finally, environmental factors like autoscaling responsiveness, container orchestration, and cold-start penalties can shrink the usable envelope during spikes. The Load Capacity team emphasizes that capacity must be viewed as a model, not a fixed value; it should be updated as traffic patterns evolve and as you tune the stack.
How the calculator models load
The calculator provides a transparent, repeatable approach to estimating capacity using a small set of inputs. It models capacity in approximately requests per second (req/s) by tying concurrent connections to per-request time. The core idea is straightforward: more concurrent connections plus longer processing times reduce how many requests per second the server can sustain. A safety margin accounts for bursts, background tasks, and measurement uncertainty. The inputs you provide are used in a simple formula that can be expanded as you gain data. The result is an estimated capacity that can guide provisioning decisions, autoscaling policies, and capacity planning reviews. Remember that the model is a tool to compare scenarios, not a crystal ball. Real systems exhibit variability, so use the output as a baseline and validate it with load tests and monitoring. As you tweak parameters, you will see clearly how each factor shifts the envelope and where optimization opportunities lie.
Real-world scenarios and examples
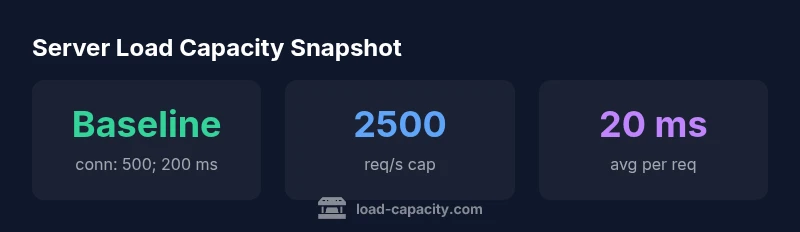
Consider a service with a moderate level of concurrency and typical processing times. For example, a workload with 800 concurrent connections and an average processing time of 60 ms yields a capacity range that, after applying a safety margin, informs how many requests per second you can sustain during peak periods. In a caching-optimized stack with shorter response times (e.g., 20 ms) and the same concurrency, capacity increases notably, illustrating how caching layers boost the envelope. Conversely, TLS termination at every layer, large payloads, or slow database queries can shrink the usable envelope, reinforcing the need to account for security, storage, and I/O in planning. Use these scenarios to model your own traffic patterns: define peak period, average load, and tail latency. Pair results with monitoring dashboards for validation. The aim is to understand how changes in concurrency, latency, and architecture move the system along the envelope you defined.
Common pitfalls and optimization tips
- Pitfall: treating capacity as static. The envelope shifts with traffic and software updates; revisit your model after changes.
- Tip: include caching, CDN, and TLS overhead in your scenario assumptions to avoid optimistic estimates.
- Tip: test with bursty workloads to observe tail latency and queueing behavior.
- Note: document all assumptions and data sources so audits and reviews are straightforward.
- Warning: rely on a single test result; triangulate with production monitoring and synthetic tests.
In practice, combine capacity estimates with autoscaling thresholds, budget-aware provisioning, and a healthy safety margin. Regularly revalidate your model against real traffic data, and keep stakeholders aligned with clear, auditable calculations. When used thoughtfully, capacity planning reduces outages, accelerates deployments, and optimizes resource use.