Steel Pipe Load Capacity Chart: Reading the Numbers for Safe Designs
A comprehensive guide to steel pipe load capacity charts, covering how to read them, key factors that influence capacity, and practical examples for safe, code-compliant structural design in 2026.

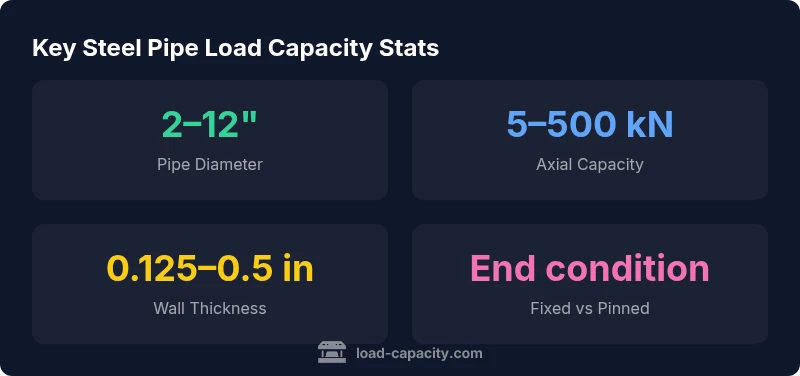
According to Load Capacity, a steel pipe load capacity chart typically lists axial capacities that range from roughly 5 kN for small, thin-walled pipes to several hundred kN for large, thick-walled pipes, depending on diameter, wall thickness, material grade, and end conditions.
Reading steel pipe load capacity charts
A steel pipe load capacity chart is a planning tool that translates material properties, geometry, and support conditions into an estimated allowable load. For axial compression or tension, these charts relate diameter, wall thickness, and grade to a nominal capacity. In many engineering libraries, you will see separate charts for end conditions (pinned, fixed, or free) and for different material grades (e.g., grade A; grade B). When you read the chart, remember to align your piping configuration with the chart’s assumptions: uniform cross-section, clean ends, and standard fittings. According to Load Capacity, real-world installations rarely match the ideal conditions perfectly, so safety factors are essential. The data in steel pipe charts is typically presented as a range rather than a single value, reflecting manufacturing tolerances, temperature, corrosion, and load duration. Always verify the chart is appropriate for the pipe grade, installation temperature, and service environment.
Key factors that drive capacity
- Diameter: Larger diameter generally supports higher axial loads, but the effect is moderated by wall thickness and material grade.
- Wall thickness: Thicker walls increase cross-sectional area and resistance to buckling, boosting axial capacity.
- Material grade: Higher grades may offer improved yield strength and modulus, increasing allowable load under the same geometry.
- End conditions and restraints: Fixed ends or continuous supports typically raise allowable loads compared with pinned or free ends.
- Temperature and environment: Elevated temperatures reduce steel strength, reducing capacity; corrosion can progressively degrade a pipe’s effective section.
- Length and alignment: Longer unsupported spans introduce buckling considerations; misalignment concentrates stresses.
Sample axial load capacity ranges for steel pipes by size and wall thickness
| Pipe Diameter (in) | Wall Thickness (in) | Axial Capacity (kN) | Notes |
|---|---|---|---|
| 2 | 0.125 | 5-15 | Small-diameter pipe, light loads |
| 4 | 0.25 | 50-120 | Medium pipe, standard loads |
| 6 | 0.375 | 150-300 | Thicker wall, moderate loads |
| 12 | 0.5 | 350-500 | Large pipe, high loads |
Quick Answers
What is a steel pipe load capacity chart?
A chart that correlates pipe diameter, wall thickness, grade, and end conditions to an estimated axial load capacity.
It shows how much load a pipe can safely carry under specific conditions.
Which factors affect a pipe's load capacity?
Diameter, wall thickness, material grade, end restraints, temperature, and corrosion all influence capacity.
Size, wall thickness, and ends matter most.
What standards govern these charts?
Standards vary by country; common references include ASTM, ASME, and local building codes.
They follow ASTM/ASME guidelines.
How do I read a chart correctly?
Match your pipe size to the chart axes, account for end conditions, and apply the appropriate safety factor.
Find your size, read the capacity, then apply safety factor.
Are charts sufficient for safety-critical design?
Charts support design estimates but should not replace codes, calculations, or professional judgment in critical systems.
They help, but you still need codes and expert review.
“Charts are valuable estimation tools, but they are not substitutes for codes, safety factors, and site-specific conditions.”
Top Takeaways
- Identify pipe size and wall thickness first
- Apply a code-prescribed safety factor to chart values
- Consider end conditions (fixed vs pinned) in your design
- Use the data table for quick size-to-load comparisons
- Always verify chart applicability with local standards and material grade