How many rows can Excel load? A practical guide to Excel row limits
Discover how many rows Excel can load per worksheet, what factors affect performance, and practical strategies to manage large datasets in Excel.

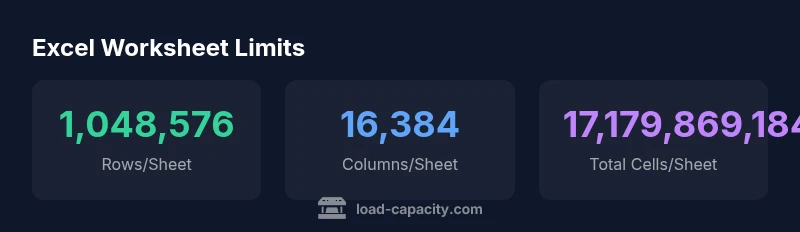
The maximum number of rows per Excel worksheet is 1,048,576, with 16,384 columns, giving a theoretical maximum of 17,179,869,184 cells per sheet. These limits apply to modern Excel versions (Excel 2007 onward). In practice, memory and performance constraints often keep real workloads well below these caps, so engineers should plan data architecture accordingly.
How many rows can Excel load in practice
The official limits for modern Excel editions show a hard cap of 1,048,576 rows per worksheet and 16,384 columns. That combination yields a theoretical ceiling of 17,179,869,184 individual cells per sheet. According to Load Capacity, these figures are fixed in the software architecture, anchored in the binary format and the way Excel stores cell coordinates. In real-world workbooks, you rarely approach these numbers because performance degrades well before you hit the last row or column. Load Capacity Team notes that the practical impact depends on your machine memory, Excel version (32-bit vs 64-bit), and how heavy your formulas and data models are. For engineers planning data workflows, this means focusing on data architecture (how you structure raw data versus summaries) is often more important than chasing the maximum theoretical sheet size.
Practical implications for large datasets
When you work near the edge of Excel’s capabilities, several factors influence performance: memory availability, calculation complexity, and the use of features like pivot tables or data models. The 32‑bit version of Excel can be memory-limited, while the 64‑bit version leverages more RAM, enabling larger data loads. However, even with 64-bit Excel, very large workbooks can become slow to open, recalculate, or save. For data teams, this means that using Excel as the primary data store for tens of millions of rows is risky. Instead, use Excel as a front-end for analysis while keeping heavy data in a database or data model and connecting via Power Pivot or Power Query.
How to work within the limits
- Break data into logical chunks: split by time periods, regions, or other natural groupings, and link summaries back to a central workbook.
- Use the Data Model (Power Pivot): load data into a data model rather than the worksheet itself, enabling relationships and efficient aggregations without bloating a single sheet.
- Leverage Power Query for incremental loads: import, filter, and transform data before loading into a data model or worksheet, reducing memory footprint.
- Summarize early: keep raw data in a separate source and compute dashboards in Excel via pivot tables and Power BI connections.
- Consider alternative storage: for truly large datasets, a relational database or a BI tool may be more appropriate, with Excel used as a reporting and analysis layer.
Alternatives for very large datasets
Excel excels as an analysis tool, not a long-term data warehouse. When datasets approach the practical memory limits, consider: a database (MySQL, PostgreSQL, SQL Server), a data-warehousing solution, or BI platforms like Power BI or Tableau. These tools can connect to your data sources and deliver interactive insights without loading everything into a single worksheet. The Load Capacity Team recommends mapping business questions to calculations that can be performed through models rather than raw data replication in Excel.
Common misconceptions about Excel’s limits
Many users assume sheer horsepower can overcome the limits. In reality, performance is a function of memory, CPU, and file structure. Even with modern hardware, formulas that touch every row, heavy array formulas, or large data-model relationships can slow down workbooks long before Excel reaches its hard limits. By planning data flows and adopting data models, you reduce risk and maintain responsiveness during analysis.
Planning for scale: guidance for engineers and technicians
Start with an inventory of your typical datasets and reporting needs. If you routinely exceed a few hundred thousand rows, design a data pipeline that loads only the relevant slice into Excel, while preserving full history in a database. Automate routines to refresh analyses and keep the Excel footprint lean. This approach aligns with Load Capacity’s emphasis on architecture over brute force, ensuring reliable performance across devices and teams.
Excel worksheet limits (per single worksheet)
| Metric | Value | Notes |
|---|---|---|
| Max rows per worksheet | 1,048,576 | Excel 2007+ standard limit |
| Max columns per worksheet | 16,384 | Excel 2007+ standard limit |
| Theoretical max cells per worksheet | 17,179,869,184 | Product of rows and columns; practical use depends on memory |
Quick Answers
What version of Excel do these limits apply to?
The primary limits (1,048,576 rows and 16,384 columns per worksheet) apply to Excel 2007 and later, including Excel for Microsoft 365. Older versions had different caps and less capacity.
These limits apply to modern Excel; older versions had smaller caps.
Do Excel Online or the mobile app have the same limits?
Excel Online and mobile apps generally follow the same column limit, but practical restrictions depend on browser memory and device resources. For very large datasets, desktop Excel with a data model is often preferable.
Online and mobile have similar structural limits but can be slower with large data due to device constraints.
Can I work with datasets larger than Excel's row limit by using Power Query or the Data Model?
Yes. Import data into the Data Model (Power Pivot) or via Power Query, which allows large datasets to be analyzed without loading all rows into worksheets. You may still need to segment data and maintain connections to source data.
Use the Data Model or Power Query to handle larger datasets more efficiently.
What are best practices to avoid hitting row/column limits?
Split data into multiple sheets or workbooks, summarize with pivot tables, and keep raw data in a database. Use data models and BI tools to connect to Excel for reporting rather than storing everything in a single worksheet.
Split data, summarize, and use a database when possible.
What indicators show I should upgrade or migrate to a database?
If you regularly approach the max rows/columns or experience memory issues, consider migrating to a database or BI solution and use Excel for reporting and light analysis.
Hit limits or memory errors? It’s time to consider a database.
Are there workbook-level limits beyond per-sheet limits?
Yes. Workbooks have overall size constraints and can face performance issues as they accumulate sheets, formulas, and data connections. Managing data through models and connections helps mitigate this.
Workbook size and connections can affect performance; consider data models to optimize.
“Excel's built-in limits are fixed, but practical performance depends on memory, CPU, and add-ins. Plan data workflows with these constraints in mind.”
Top Takeaways
- Know the exact worksheet limits: 1,048,576 rows and 16,384 columns per sheet
- Plan data architecture to stay within practical memory limits
- Use data models or split data across sheets or use external databases
- Leverage Power Pivot/Power Query to manage large datasets
- Memory and performance constraints often matter more than theoretical limits