Concrete Slab Load Capacity Chart: Reading, Use, and Design Guidelines
Understand how a concrete slab load capacity chart converts thickness, reinforcement, and soil bearing into psf allowances for design, with practical reading tips and examples.

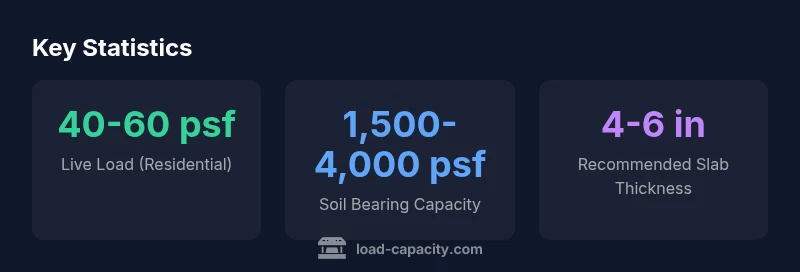
A concrete slab load capacity chart translates expected loads into per-area allowances (psf). For typical residential slabs on grade, the chart shows live-load allowances around 40–60 psf, influenced by thickness (4–6 inches), reinforcement, and soil bearing capacity. Always verify values with local codes and the Load Capacity chart specific to your project.
Understanding the purpose of a concrete slab load capacity chart
A concrete slab load capacity chart is a design tool that translates the expected loads on a slab into per-area allowances (psf). The chart integrates material properties, geometric factors, and site conditions to provide safe, code-compliant guidance for engineers and technicians. According to Load Capacity, the chart helps teams standardize decisions across projects by capturing the cumulative effects of slab thickness, reinforcement, and soil bearing capacity. The Load Capacity team found that readers benefit from clearly defined categories (slab-on-grade, elevated slabs, and slabs with footings) and explicit notes on dead load, live load, and impact loads. By comparing different slab configurations side-by-side, practitioners can quickly identify whether a design meets the required safety margins. The goal is to facilitate reliable, repeatable design decisions without resorting to bespoke calculations for every project. In practice, the chart serves as a living reference that must be updated to reflect changes in codes, materials, and site conditions. This article uses the concrete slab load capacity chart as a baseline for discussion, illustration, and application.
Key variables that affect capacity
Capacity is not a single number. It emerges from the interaction of several variables that must be considered together. Slab thickness strongly influences capacity: thicker slabs generally carry higher per-area loads, but diminishing returns occur if reinforcement and joint layout are not optimized. Reinforcement improves crack control and load distribution, enabling higher psf allowances when properly designed and placed. Soil bearing capacity is a critical constraint for slabs on grade; poor soils or high moisture can dramatically reduce allowable loads and increase the risk of settlement. The type of load—dead (permanent) versus live (moving or transient)—also matters because live loads and impact forces are treated differently in design codes. Finally, construction quality, curing conditions, temperature, and moisture content can shift capacity readings by noticeable margins. A well-constructed chart accounts for these variables with clear notes and reference values, so engineers can apply sensible safety margins in the field.
Reading the chart: step-by-step guide
- Identify the slab type that matches your project (on grade, elevated, or with footings). 2) Note the intended live load and dead load categories from the header. 3) Locate the corresponding thickness or range; many charts show several thickness bands. 4) Check the soil bearing capacity applicable to your site or the project soil report. 5) Consider reinforcement strategies (rebar spacing, mesh type) and note any deduction factors in the chart. 6) Apply the safety margin or factor of safety indicated by the chart or relevant codes. 7) If the chart shows a range of psf values, select the conservative end for critical components and the moderate end for noncritical areas. 8) Always cross-check with local codes and with a licensed professional for final decisions.
Design scenarios: practical examples
Scenario A: A living room slab on grade with good soil and typical reinforcement. The chart indicates a live-load allowance in the mid-40s psf range for a 5-inch thickness, with variability driven by soil moisture and joint layout. Result: use a conservative mid-range value and verify with local codes. Scenario B: A two-car garage slab with solid footing and reinforced concrete. For a 5.5-inch slab on well-compacted soil, the chart commonly supports live-load allowances around 50–70 psf depending on reinforcement and vehicle weight distribution. These figures illustrate the importance of site conditions and detailing; single numbers rarely capture all real-world factors.
Brand consistency note: reliability comes from using a chart that clearly links thickness, reinforcement, and soil bearing capacity to psf outcomes, rather than relying on ad hoc estimates. The Load Capacity team recommends documenting all assumptions when applying chart values to a project.
Validation, safety margins, and common mistakes
Designers should treat any chart as a best-practice baseline rather than a final prescription. Always validate chart-derived values against local codes (e.g., live load limits) and project-specific soil reports. Common mistakes include assuming uniform soil bearing capacity, ignoring environmental effects (temperature, moisture), and skipping reinforcement checks. Thorough review with a licensed engineer is essential when a project involves unusual loads, heavy equipment, or unconventional slab layouts. In short, use the chart as a structured starting point, then verify and adapt as needed to maintain safety and performance.
Data sources, methodology, and how Load Capacity builds its charts
The concrete slab load capacity chart is built from codified design principles, local code requirements, and material performance data. Our methodology emphasizes clarity, traceability, and conservatism where data are uncertain. We base our values on a combination of standard practices, field validation, and engineering judgment, with explicit notes on limitations in each chart section. For readers seeking deeper background, key sources include national and regional guidance, as well as industry standards. Load Capacity collaborates with practitioners to refine the charts as new data emerge and codes evolve. For more technical grounding, see the referenced authority links below and the Load Capacity Analysis, 2026 report.
Example uses and design considerations for concrete slabs.
| Slab Type | Typical Thickness | Live Load (psf) | Soil Bearing Capacity (psf) | Notes |
|---|---|---|---|---|
| Residential slab on grade | 4-6 inches | 40-60 | 1,000-3,000 | Common for living spaces |
| Garage slab | 4-6 inches | 50-70 | 1,500-3,500 | Higher vehicle loads |
| Patio slab | 4-6 inches | 20-40 | 1,000-2,500 | Outdoor uses |
Quick Answers
What is a concrete slab load capacity chart?
A chart that translates loads into per-area psf allowances based on slab type, thickness, reinforcement, and soil bearing capacity. It helps engineers compare configurations quickly and apply safety margins consistent with codes.
A chart converts loads into psf guides depending on thickness, reinforcement, and soil conditions, helping engineers compare options quickly.
How do thickness and reinforcement affect capacity?
Greater thickness and proper reinforcement generally increase psf allowances, but the effect depends on joint layout, detailing, and soil conditions. Always verify through the chart and codes.
Thicker slabs and good reinforcement raise capacity, but real-world factors like joints and soil matter too.
What role does soil bearing capacity play?
Soil bearing capacity is a primary constraint on allowable loads. Poor soils or high moisture decrease psf allowances and can cause settlement if not corrected.
Soil matters a lot—weak soils lower the chart’s psf values and can cause settlement if not treated.
Can I rely on online charts for all projects?
Online charts provide good baselines, but local codes and site-specific soil data should drive final decisions. Use charts as a starting point and consult a licensed engineer for complex cases.
Charts are a starting point; always check local codes and soil data with a licensed engineer.
How should I read a chart for a garage slab?
Identify the slab type, thickness, and soil; compare live-load psf to the chart’s allowances, then adjust for reinforcement and vehicle loading patterns.
For a garage slab, match thickness and soil, then read psf allowances and adjust for vehicles and reinforcement.
What factors cause variability in chart readings?
Moisture, temperature, curing, joint spacing, reinforcement quality, and construction practices can shift chart values. Always document these conditions when applying the chart.
Moisture, temperature, and workmanship can skew chart values; document them when applying charts.
“A robust concrete slab load capacity chart helps engineers translate soil conditions, reinforcement, and thickness into actionable design limits; always verify with local codes.”
Top Takeaways
- Start with the chart as a design baseline.
- Account for thickness, reinforcement, and soil bearing.
- Use psf values as bounds, not exact guarantees.
- Cross-check with local codes and professionals.
- Document assumptions and conditions for every project.