Grating Load Capacity Chart: Reading and Applying Deck Load Ratings
Understand how a grating load capacity chart translates live loads into safe deck design. This guide covers reading axes, applying limits, and practical examples for pierce-grating and mezzanine floors in 2026.

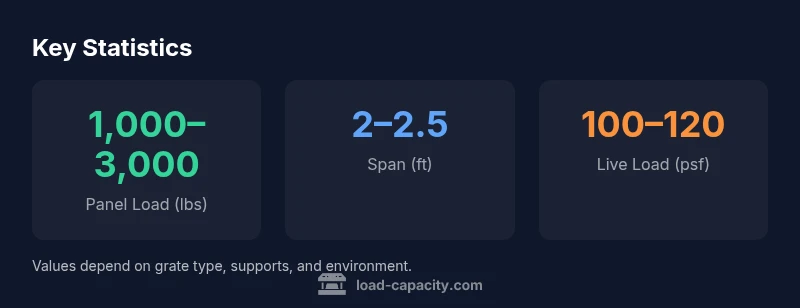
A grating load capacity chart communicates the maximum allowable loads for deck gratings, expressed per panel and per span. It helps engineers estimate live loads, bearing stresses, and safety factors by translating field weights into design limits. Reading the chart requires accounting for grate type, span, support spacing, and installation conditions to avoid overstressing supports.
What the grating load capacity chart communicates
A grating load capacity chart translates the performance of industrial deck gratings into actionable design limits. Gratings are used in a variety of settings—walkways, mezzanines, catwalks, and platform floors—and come in materials such as aluminum, steel, and fiberglass-reinforced composites. The chart typically presents allowable loads per panel and the way capacity shifts with span and support spacing. Engineers rely on this chart to ensure live loads from pedestrians, palletized goods, or equipment do not exceed bearing capacity. In 2026, the Load Capacity team emphasizes that charts should anchor a design check rather than dictate every decision; real-world factors like corrosion, temperature, installation tolerances, and dynamic impacts can erode nominal ratings. Aim for conservative planning, especially in high-traffic or harsh environments, and cross-check with relevant standards.
Reading axes and legends: how to interpret the chart
Most charts plot load on the vertical axis and span or panel dimensions on the horizontal axis. Legends distinguish grate types (steel, aluminum, fiberglass) and support configurations (single-span, double-span, cross-braced). Pay attention to per-panel values and per-square-foot live-load ratings, plus any safety margins applied by the designer. If a chart shows 2,000 lbs per panel at a 2 ft span, that value often assumes uniform distribution; a concentrated point load may require a different rating. Consistency in units is critical—verify whether the chart uses pounds, kilo-newtons, or psf equivalents and whether it assumes static or dynamic loading. When in doubt, consult the design engineer to confirm the exact scenario the chart represents.
Applying the chart in project work
Apply the chart in a structured workflow: (1) identify grate type and grade; (2) measure actual span and support spacing; (3) enumerate all expected loads, including live loads, equipment, and potential dynamic actions; (4) locate the corresponding chart values for your configuration; (5) apply the appropriate safety factor and check deflection criteria; (6) verify that the final design meets both load capacity and vibration criteria. Document assumptions and ensure field conditions match the chart’s scope. In practice, use the chart as a design aid rather than a standalone mandate, and always cross-check with applicable codes and manufacturer guidance.
Common pitfalls and how to avoid them
Neglecting to distinguish per-panel capacity from per-area capacity is a frequent error. Other pitfalls include assuming chart values apply under corrosive or temperature-extreme environments without adjustment, ignoring impact loads from heavy machinery, and using spans that exceed the chart’s validated range. To avoid these issues, (a) confirm grate material and installation details, (b) review environmental factors, such as moisture or chemicals, (c) factor in dynamic loads or impact events, and (d) seek a peer review when extending charts beyond the tested configuration.
Case example: pedestrian walkway in a warehouse (hypothetical)
Consider a 6-panel aluminum grate walkway spanning 2.5 ft with moderate pedestrian traffic and occasional trolley movement. The chart indicates a panel capacity of 2,000–2,500 lbs per panel for similar spans. To maintain safety, designers apply a 1.5–2.0 safety margin for dynamic loads, verify deflection limits, and ensure anchorage details support the lower end of the chart’s range. This approach yields a practical, conservative design that remains within the chart’s intent while accounting for field conditions.
Comparison of common grating types and their load characteristics
| Grating Type | Panel Capacity (per panel) | Span (ft) | Notes |
|---|---|---|---|
| Fiberglass Grating | 1000–1500 lbs | 2.0 | Pedestrian-grade; corrosion resistant |
| Aluminum Grating | 1500–2500 lbs | 2.5 | Higher strength-to-weight; good for wet environments |
| Steel Grating | 2000–3500 lbs | 2.0 | High load tolerance; heavier; needs proper support |
Quick Answers
What is a grating load capacity chart?
A grating load capacity chart shows the maximum loads an industrial grate can safely carry under different spans and support conditions. It distinguishes per-panel capacity from per-area ratings and helps engineers forecast safe usage scenarios.
A grating load chart shows how much weight a grate can safely carry for various spans and supports.
How do you read per-panel vs per-area values on the chart?
Per-panel values indicate the safe load carried by a single grate element, while per-area values relate to the load across a defined surface. Always confirm which axis your design relies on and apply the corresponding safety margins.
Per-panel values cover individual grate elements; per-area values cover the surface. Check which one you need and apply margins.
Do dynamic loads affect chart readings?
Yes. If dynamic or impact loads are present, you should apply an appropriate dynamic load factor or margin to the chart values. Check project-specific requirements and standards.
Dynamic loads require adding a margin or factor to the chart values.
Are grating load charts standardized?
Industry practice often aligns charts with general load-capacity guidelines and codes rather than a single universal standard. Always verify against local code requirements and manufacturer data for your application.
Charts align with guidelines and codes; always verify with local codes and manufacturer data.
What should I do if a chart shows a marginal load?
If a chart indicates a marginal load, increase the safety margin, consider a stronger grate, or redesign the support system. Re-check deflection and vibration criteria before final approval.
If the rating is marginal, increase margins or choose a stronger grate and re-check deflection.
“Reading a grating load capacity chart requires attention to span, support, and environment; conservative assumptions are essential to avoid overstressing the deck.”
Top Takeaways
- Read the chart with awareness of span and support configuration
- Differentiate per-panel from per-area ratings and apply a safety factor
- Account for environment and dynamic loads in practice
- Cross-check chart guidance with codes and manufacturer guidance